ECON MACRO
5th Edition
ISBN: 9781337000529
Author: William A. McEachern
Publisher: Cengage Learning
expand_more
expand_more
format_list_bulleted
Question
thumb_up100%

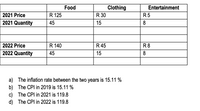
Transcribed Image Text:Clothing
R 30
Food
Entertainment
2021 Price
R 125
R5
2021 Quantity
45
15
8
2022 Price
R 140
R 45
R8
2022 Quantity
45
15
8
a) The inflation rate between the two years is 15.11 %
b) The CPI in 2019 is 15.11 %
c) The CPI in 2021 is 119.8
d) The CPI in 2022 is 119.8
Expert Solution
This question has been solved!
Explore an expertly crafted, step-by-step solution for a thorough understanding of key concepts.
Step by stepSolved in 2 steps

Knowledge Booster
Learn more about
Need a deep-dive on the concept behind this application? Look no further. Learn more about this topic, economics and related others by exploring similar questions and additional content below.Similar questions
- Year | price of meat (per Kg) price of bread (per Kg) price of gas (per lt) housing price (monthly rent of 1 bd unit) $10 $20 S1.5 S1000 $12 S18 S1.5 $1200 Suppose a consumer basket consists of 40 Kg meat, 50 Kg bread, 400 It gas, and a one bedroom apartment for one year. Using the table above, compute the inflation rate in this economy based on CPI between years 1 and 2. 10% 12% 6% 17%arrow_forwardQuestion 14 Refer to the information provided in Table 22.6 below to answer the question(s) that follow. Table 22.6 Price per Unit in 2014 Units Purchased 5. 2015 2016 $1.00 $2.00 $4.00 $1.50 $2.50 $1.50 $3.00 Good A Good B 10 Good C $4.50 $5.00 Refer to Table 22.6. If 2014 is the base year, the inflation rate between 2014 and 2016 is 40.2%. 28.7%. 25.1%. 17.4%.arrow_forwardYear price of meat (per Kg) price of bread price of gas (per Kg) (per It) housing price (monthly rent of 1 bd unit) $1000 1 $10 $20 $1.5 2 $12 $18 $1.5 $1200 Suppose a consumer basket consists of 40 Kg meat, 50 Kg bread, 400 It gas, and a one bedroom apartment for one year. Using the table above, compute the inflation rate in this economy based on CPI between years 1 and 2. 17% 12% 6% 10%arrow_forward
- Use the information below to: a) compute the price index for each year using 2019 as the base year. b) compute the inflation rate between the two years. Item Quantity Unit Price-2018 Unit Price-2019 Coffee 20 pounds $7.00 $8.00 Rent 12 months 950.00 1,000.00 Pizza 100 pizzas 12.00 14.00 Cable 12 months 55.00 60.00 Vacation 2 weeks 550.00 600.00arrow_forwardIf the CPI in period 1 is 180 and the CPI in period 2 is 240, then the rate of inflation between period 1 and period 2 is 66.7% 50% 33.3% 25%arrow_forwardPrice of wine Price of coffee 2021 $5 $5 2022 $9 $6 Assuming that wine and coffee consumption are fixed as 10 wine and 20 cups of coffee. Calculate the inflation rate between 2021 and 2022. (Note: the cost of the basket in the base year is 120) 40% 35% 22.5% 28%arrow_forward
- Suppose the basket of goods used for a Canadian university student price index consists of 2 terms of full-time study and 4 textbooks. Prices of the goods by year are as follows: Year Full-time tuition for Price of One one term Textbook 2018 $3,605 $115 2019 $3,631 $139 2020 $3,924 $189 a) Using 2018 as the base year, compute the university student price index for 2018, 2019 and 2020, and the inflation rate between 2018 and 2019, and between 2019 and 2020. b) Suppose that all university textbooks were produced in the United States. Would Canada's GDP Deflator increase more, less or the same rate as the student price index (based only on these two goods)?arrow_forwardThe country of Panem produces only bow and arrow. Quantities and prices of these goods for the last several years are shown below. The base year is 2010. Prices and Quantities Price of Bow Quantity of Price of Quantity of Bow Year Arrow Arrow 2010 $10.00 200 $3.50 380 2011 $10.00 220 $5.00 400 2012 $11.00 250 $5.50 400 2013 $12.00 280 $6.50 440 What is the inflation rate in 2011? 8.79% 12.92% 16.67% None of the abovearrow_forwardIn a specified year, nominal gross domestic product grew by 12 percent and real gross domestic product grew by 5 percent.What would be the inflation 7% -7% 8% 179%arrow_forward
- Assume that the retail price index (RPI) for the UK was 100 in January 1950 and 3246 in January 2015. Calculate the average annual inflation rate.arrow_forwardPlease answer quickly and correctly The CPI-U (U.S. city average, all items) has the following annual averages: Year 2013 2014 2015 2016 2017 Index 208.1 213.3 214.5 216.0 217.4arrow_forwardHenrique is a baseball fan and attends several games per season. His expenses per season are listed in the table below: Year 1 Year 2 5 Baseball Tickets $500 $600 Jersey $100 $120 Food $150 $150 Transport $50 $80 Calculate the inflation rate for Henrique's baseball season between year 1 and 2.arrow_forward
arrow_back_ios
SEE MORE QUESTIONS
arrow_forward_ios
Recommended textbooks for you

