Exploring Economics
8th Edition
ISBN: 9781544336329
Author: Robert L. Sexton
Publisher: SAGE Publications, Inc
expand_more
expand_more
format_list_bulleted
Question

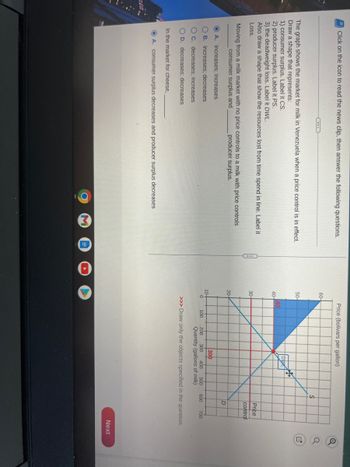
Transcribed Image Text:Click on the icon to read the news clip, then answer the following questions.
The graph shows the market for milk in Venezuela when a price control is in effect.
Draw a shape that represents:
1) consumer surplus. Label it CS.
2) producer surplus. Label it PS.
3) the deadweight loss. Label it DWL.
Also draw a shape that show the resources lost from time spend in line. Label it
Loss.
Moving from a milk market with no price controls to a milk with price controls
consumer surplus and
producer surplus.
OA. increases; increases
OB. increases; decreases
OC. decreases; increases
OD. decreases; decreases
In the market for cheese,
OA. consumer surplus decreases and producer surplus decreases
60-
50-
40-
30
20-
10-
Price (bolivars per gallon)
0
40
$
300
200 300 400 500 600 700
Quantity (gallons of milk)
>>> Draw only the objects specified in the question.
100
Price
control
D
Next
SOU

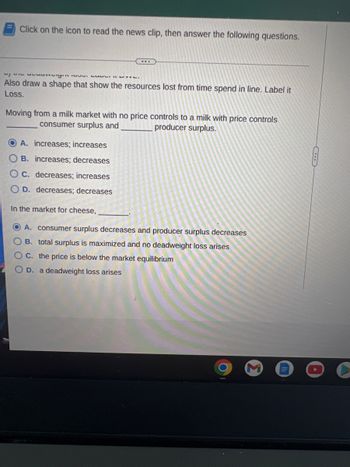
Transcribed Image Text:Click on the icon to read the news clip, then answer the following questions.
...
1/47 Suvungin NL.
Also draw a shape that show the resources lost from time spend in line. Label it
Loss.
Moving from a milk market with no price controls to a milk with price controls
consumer surplus and
producer surplus.
OA. increases; increases
B. increases; decreases
OC. decreases; increases
OD. decreases; decreases
In the market for cheese,
OA. consumer surplus decreases and producer surplus decreases
B. total surplus is maximized and no deadweight loss arises
OC. the price is below the market equilibrium
OD. a deadweight loss arises
Expert Solution
This question has been solved!
Explore an expertly crafted, step-by-step solution for a thorough understanding of key concepts.
This is a popular solution
Trending nowThis is a popular solution!
Step by stepSolved in 2 steps with 1 images

Knowledge Booster
Learn more about
Need a deep-dive on the concept behind this application? Look no further. Learn more about this topic, economics and related others by exploring similar questions and additional content below.Similar questions
- Draw a supply curve for turkey.In your diagram, show a price of turkey and the producer surplus at that price. explain in words what this producer surplus measures.arrow_forwardClick on the icon to read the news clip, then answer the following questions. www The graph shows the market for milk in Venezuela when a price control is in effect. Draw a shape that represents: 1) consumer surplus. Label it CS. 2) producer surplus. Label it PS. 3) the deadweight loss. Label it DWL. Also draw a shape that show the resources lost from time spend in line. Label it Loss. Moving from a milk market with no price controls to a milk with price controls consumer surplus and producer surplus. OA. increases; decreases OB. decreases; increases Oc. increases; increases OD. decreases; decreases In the market for cheese, OA. the price is below the market equilibrium 9 O 60- 50- 40- 30- 20- Price (bolivars per gallon) 10+ 0 40 $ 100 Price control 300 200 300 400 500 600 700 Quantity (gallons of milk) >>> Draw only the objects specified in the question. D Nextarrow_forwardHelp please with the graph and my answer is correct or incorrectarrow_forward
- K Click on the icon to read the news clip, then answer the following questions The graph shows the market for milk in Venezuela when a price control is in effect Draw a shape that represents 1) consumer surplus Label it CS 2) producer surplus Label it PS 3) the deadweight loss Label it DWL Also draw a shape that show the resources lost from time spend in line Label it Loss Moving from a milk market with no price controls to a milk with price controls, surplus and producer surplus OA. increases, decreases OB. increases, increases OC. decreases, decreases OD. decreases, increases 60- 50- Price (bolivars per gallon) 40 40- 30- consumer 20- 10+ 0 100 200 S Price control D 300 300 400 500 600 700 Quantity (gallons of milk) >>> Draw only the objects specified in the questionarrow_forwardThe graph shows the car market in Mexico when Mexico places no restriction on the quantity of cars imported. The world price of a car is $10,000. Suppose the government of Mexico introduces an import quota on imported cars of 4 million a year. Draw a line that shows the effect of the import quota on supply. Label it S + quota. Label it. Draw a point to show the quantity of cars bought in Mexico and the price paid. When the government of Mexico introduces an import quota of 4 million cars, Mexico imports nothing million cars and produces nothing million cars.arrow_forwardHow do price controls affect the market?arrow_forward
- The US government reduces the tariff on imported coffee will this affect the supply or the deman for coffeearrow_forwardwhen the price of a product decreases what happens to supply and demand. Show in a graph.arrow_forwardYou are given the following market data for Venus automobiles in Saturnia. Demand: P = 35,000 - 0.5Q Supply: P = 8,000 + 0.25Q where P = Price and Q = Quantity. a. b. C. Calculate the equilibrium price and quantity. Calculate the consumer surplus in this market. Calculate the producer surplus in this market. Use the editor to format your answerarrow_forward
- Can the supply of agriculture products keep up with the growing population's demand? cite your sources.arrow_forwardPRICE [Dolars per laptop) The following diagram shows supply and demand in the market for laptops. 150 Demand 135 120 105 90 75 60 45 30 15 Supply ° 1 0 35 70 105 140 175 210 245 280 QUANTITY (Millions of laptops) 315 350 Fill in the following blanks with integer values: The market price is The market quantity is The consumer surplus is 4200 The producer surplus is 4200 The total surplus is 8400 A price ceiling is imposed at $60. The market price is now There is now a (surplus/shortage/none) Is there deadweight loss (yes/no)? of what amount? How much if any? If a price floor is implemented at $65, would it be binding? (yes/no)arrow_forwardGive typing answer with explanation and conclusionarrow_forward
arrow_back_ios
SEE MORE QUESTIONS
arrow_forward_ios
Recommended textbooks for you
 Exploring EconomicsEconomicsISBN:9781544336329Author:Robert L. SextonPublisher:SAGE Publications, Inc
 Essentials of Economics (MindTap Course List)EconomicsISBN:9781337091992Author:N. Gregory MankiwPublisher:Cengage Learning

Exploring Economics
Economics
ISBN:9781544336329
Author:Robert L. Sexton
Publisher:SAGE Publications, Inc

Essentials of Economics (MindTap Course List)
Economics
ISBN:9781337091992
Author:N. Gregory Mankiw
Publisher:Cengage Learning
