MATLAB: An Introduction with Applications
6th Edition
ISBN: 9781119256830
Author: Amos Gilat
Publisher: John Wiley & Sons Inc
expand_more
expand_more
format_list_bulleted
Concept explainers
Topic Video
Question

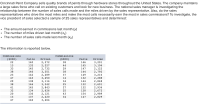
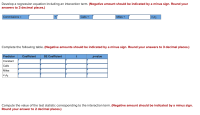
Transcribed Image Text:Cincinnati Paint Company sells quality brands of paints through hardware stores throughout the United States. The company maintains
a large sales force who call on existing customers and look for new business. The national sales manager is investigating the
relationship between the number of sales calls made and the miles driven by the sales representative. Also, do the sales
representatives who drive the most miles and make the most calls necessarily earn the most in sales commissions? To investigate, the
vice president of sales selected a sample of 25 sales representatives and determined:
The amount earned in commissions last month (y)
The number of miles driven last month (x1)
The number of sales calls made last month (x2)

Expert Solution
This question has been solved!
Explore an expertly crafted, step-by-step solution for a thorough understanding of key concepts.
This is a popular solution
Trending nowThis is a popular solution!
Step by stepSolved in 3 steps with 3 images

Knowledge Booster
Learn more about
Need a deep-dive on the concept behind this application? Look no further. Learn more about this topic, statistics and related others by exploring similar questions and additional content below.Similar questions
- The London School of Economics and the Harvard Business School have conducted studies of how chief executive officers (CEOS) spend their time. These studies have found that CEOs spend many hours per week in meetings, not including conference calls, business meals, and public events (The Wall Street Journal). Shown below is the time spent per week in meetings (hours) for a sample of 25 CEOS. 20 20 23 15 19 a. What is the least amount of time spent per week on meetings? The highest? 17 - 18 19 - 20 21 22 23 24 Total Prepare a histogram 22 23 14 19 17 Frequency b. Use a class width of two hours to prepare a frequency distribution and a percent frequency distribution for the data. Round your answers to the nearest whole number. If your answer is zero, enter "0". Hours in Meetings per week 11-12 13 - 14 15 - 16 Percent Frequency % % % % 12 % % % % 18 13 15 23 23 17 12 15 19 21 20 12 17 21arrow_forwardThe Bureau of Transportation reports on-time performance for airlines at major airports. JetBlue, United, and US Airways share Terminal C and Boston's Logan Airport. The percentage of on-time flights reported for a sample month were 76.8% for JetBlue, 71.5% for United, and 82.2% for US Airways. Assume that 30% of the arriving flights at this terminal are JetBlue flights, 32% are United flights, and 38% are US Airways flights. a. Develop a contingency table (table of joint probabilities and marginal probabilities). b. An announcement is made that Flight 1382 will arrive at Terminal C. What is the probability that the flight will arrive on time? c. Flight 1382 arrives on time. What is the probability that Flight 1382 is operated by US Airways? d. Flight 1382 will not arrive on time. What is the probability that Flight 1382 is operated by United?arrow_forwardA simple random sample of 20 paperback novels indicates that they are, on average, 425.1 pages long. Asume that the page count for all paperback novels is Normally distributed, with a standard deviation of 92.8 pages. Calculate a 99% confidence interval for the mean.arrow_forward
- A real estate agency, located in a metropolitan area in the northeastern U.S., kept data on the various types of properties purchased in the area. Historically, 15% of purchases were for condominiums, 30% were for townhouses, 40% for single family homes, 10% for commercial properties and 5% for land. With changing demographics, the agency wondered if the current distribution matches the historical distribution. Recent data showed the following: Type of Property Condos Townhouses Homes Commercial Land Frequency 89 121 78 25 12 Based on the historical distribution, we would expect how many homes to be purchased? Question content area bottom Part 1 A. 130 B. 121 C. 129.95 D. 122.54 E. 100arrow_forwardA campus researcher wanted to investigate the factors that affect visitor travel time in a complex, multilevel building on campus. Specifically, he wanted to determine whether different building signs (building maps versus wall signage) affect the total amount of time visitors require to reach their destination and whether that time depends on whether the starting location is inside or outside the building. Three subjects were assigned to each of the combinations of signs and starting locations, and travel time in seconds from beginning to destination was recorded. How should the data be analyzed? Wall Signs Map Starting Room Interior 141, 119, 238 85, 94, 126 Randomized block design O Completely randomized design 2 x 2 factorial design Levene's test Exterior 224, 339, 139 226, 129, 130arrow_forwardAs a destination marketing director, you found that TV executives used the guideline that 25% of the viewers were watching Fox cable network, 22% watching NBC and CBS, and 19% watching ABC. The remaining 12% were watching other cable networks such as CNN and MSNBC on a weekday night. A random sample of 500 viewers in the D.C. metro area last Tuesday night showed 109 homes were tuned in to the Fox station, 125 homes tuning in to NBC affiliate, 100 homes tuning in to CBS affiliate and 81 homes tuning in to ABC affiliate. 85 homes were watching CNN and NSNBC cable stations. At the 0.05 significant level, can we conclude that the guideline is still reasonable?arrow_forward
- Wegman’s (a food market chain) has developed a new store-brand brownie mix. Before they start selling the mix they want to compare how well people like their brownies to brownies made from a popular national brand mix. In order to see if there was any difference in consumer opinion, Wegman’s asked 124 shoppers to participate in a taste test. Each was given a brownie to try. Subjects were not told which kind of brownie they got—that was determined randomly. 58% of the 62 shoppers who tasted a Wegman’s brownie said liked it well enough to buy the mix, compared to 66% of the others who said they would be willing to buy the national brand. Does this result indicate that consumer interest in the Wegman’s mix is lower than for the national brand?arrow_forwardTYPEWRITTEN ONLY PLEASE FOR UPVOTE. DOWNVOTE FOR HANDWRITTEN. DO NOT ANSWER IF YOU ALREADY ANSWERED THIS. I'LL DOWNVOTE.arrow_forwardYou are a manager for Company ABC and decide to compile data and analyze your employees’ level of satisifaction. You create a survey to ask each employee to rate their level of satisfaction working at Company ABC. Table 1 shows data of 15 people employees that responded to your survey. Each of the employees have the same job title: Sales Representative. The data set includes variables regarding an employee ID, gender, ethnicity, region, pay rate, employee satisfaction rating. Each employee was asked to rate their level of satisfaction working at Company ABC. A composite score from 0 (lowest) to 5 (highest) is shown as the data variable employee satisfaction. Table 1: Employee Data on 15 Sales Representatives at Company ABCarrow_forward
arrow_back_ios
arrow_forward_ios
Recommended textbooks for you
 MATLAB: An Introduction with ApplicationsStatisticsISBN:9781119256830Author:Amos GilatPublisher:John Wiley & Sons Inc
 Probability and Statistics for Engineering and th...StatisticsISBN:9781305251809Author:Jay L. DevorePublisher:Cengage Learning
 Statistics for The Behavioral Sciences (MindTap C...StatisticsISBN:9781305504912Author:Frederick J Gravetter, Larry B. WallnauPublisher:Cengage Learning
 Elementary Statistics: Picturing the World (7th E...StatisticsISBN:9780134683416Author:Ron Larson, Betsy FarberPublisher:PEARSON
 The Basic Practice of StatisticsStatisticsISBN:9781319042578Author:David S. Moore, William I. Notz, Michael A. FlignerPublisher:W. H. Freeman
 Introduction to the Practice of StatisticsStatisticsISBN:9781319013387Author:David S. Moore, George P. McCabe, Bruce A. CraigPublisher:W. H. Freeman

MATLAB: An Introduction with Applications
Statistics
ISBN:9781119256830
Author:Amos Gilat
Publisher:John Wiley & Sons Inc

Probability and Statistics for Engineering and th...
Statistics
ISBN:9781305251809
Author:Jay L. Devore
Publisher:Cengage Learning

Statistics for The Behavioral Sciences (MindTap C...
Statistics
ISBN:9781305504912
Author:Frederick J Gravetter, Larry B. Wallnau
Publisher:Cengage Learning

Elementary Statistics: Picturing the World (7th E...
Statistics
ISBN:9780134683416
Author:Ron Larson, Betsy Farber
Publisher:PEARSON

The Basic Practice of Statistics
Statistics
ISBN:9781319042578
Author:David S. Moore, William I. Notz, Michael A. Fligner
Publisher:W. H. Freeman

Introduction to the Practice of Statistics
Statistics
ISBN:9781319013387
Author:David S. Moore, George P. McCabe, Bruce A. Craig
Publisher:W. H. Freeman