
MATLAB: An Introduction with Applications
6th Edition
ISBN: 9781119256830
Author: Amos Gilat
Publisher: John Wiley & Sons Inc
expand_more
expand_more
format_list_bulleted
Related questions
Concept explainers
Question
Check if one of the hospitals has a (statistically significant) higher rating than the other at an alpha (level of significance) of 5%.
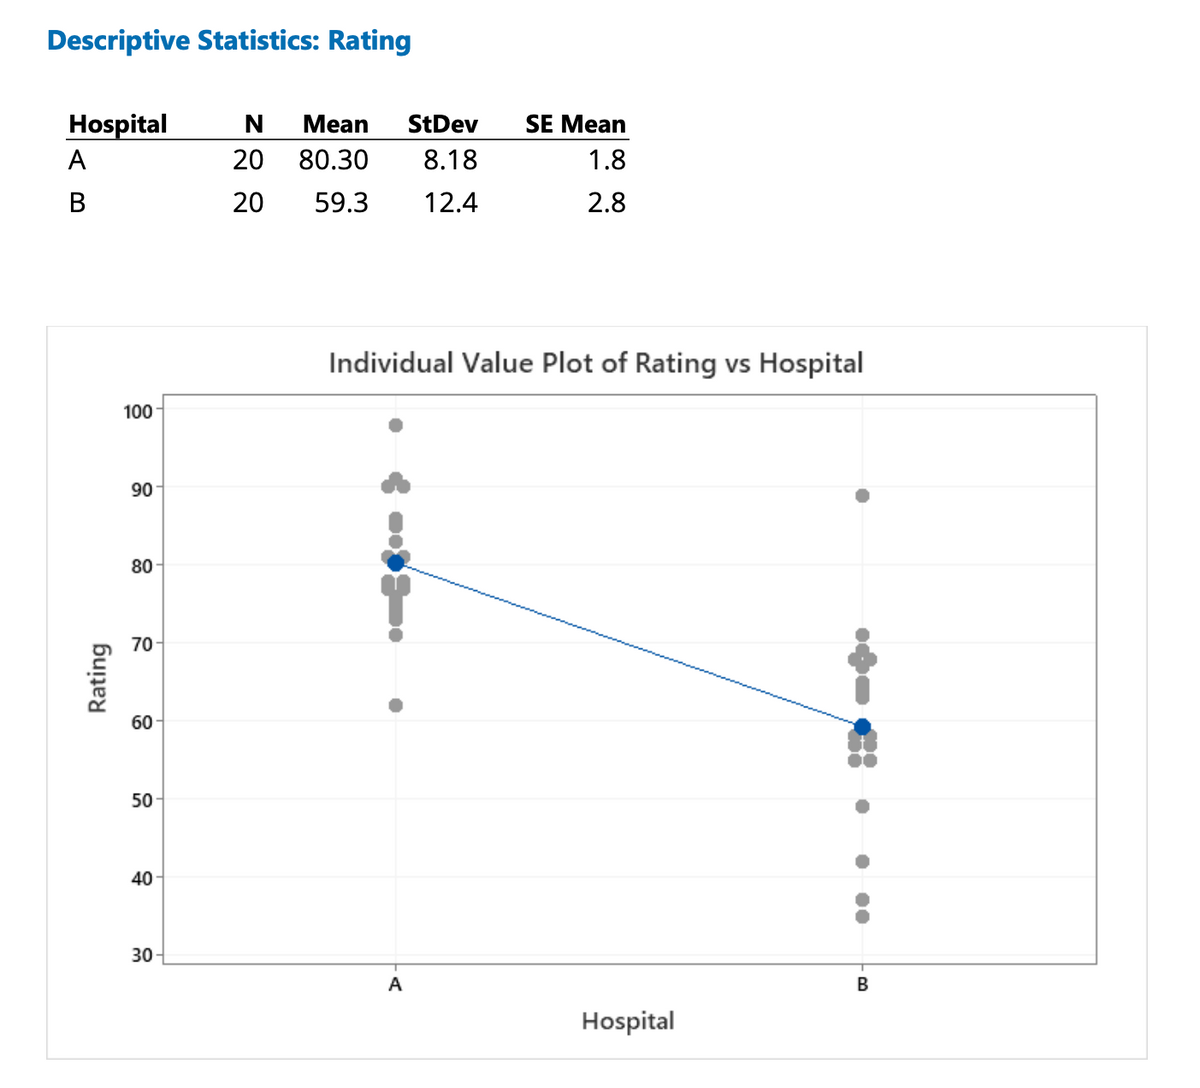

Transcribed Image Text:Descriptive Statistics: Rating
Hospital
Mean
StDev
SE Mean
A
20
80.30
8.18
1.8
В
20
59.3
12.4
2.8
Individual Value Plot of Rating vs Hospital
100
90
80
70
60
50
40
30
Hospital
Rating
• 0.

Transcribed Image Text:Problem
Hospital comparison data. A healthcare consultant wants to compare the patient satisfaction ratings
of two hospitals. The consultant collects ratings from 20 patients for each of the hospitals.
Worksheet column
Description
Rating
The rating for the hospital: 1 to 100, with 100 being the best score
Hospital
The hospital that was rated: A or B
Hospital A
Hospital B
81
89
77
64
75
35
74
68
86
69
90
55
62
37
73
57
91
42
98
49
81
59
85
58
77
65
78
71
83
67
90
58
78
63
76
68
71
55
80
57
Expert Solution
This question has been solved!
Explore an expertly crafted, step-by-step solution for a thorough understanding of key concepts.

Step by stepSolved in 2 steps

Knowledge Booster


Learn more about
Need a deep-dive on the concept behind this application? Look no further. Learn more about this topic, statistics and related others by exploring similar questions and additional content below.Similar questions
- An ANOVA is used to compare the mean GPA of the following groups of students.arrow_forwardA researcher conducts a study to investigate whether the obesity rate rural communities differ from the obesity rate from the population at large. He gathered a sample of adults from a small community, measured their weight, and compared it to the population average. What statistical test is appropriate for this study and why?arrow_forwardWhy do statisticians prefer experimental studies over observational studies?arrow_forward
- What is the difference between multivariate data set and bivariate data?arrow_forwardYou conducted a study to assess the effect of smoking on systolic blood pressure. The results showed that there was a significant association between the two variables, with an odds ratio of 1.5. Explain this finding to someone who has no background in epidemiologic research.arrow_forwardFind a real-life example of the use of ANOVA (Make sure to cite the source). Explain how and why they used ANOVA.arrow_forward
- Levi-Strauss Co manufactures clothing. The quality control department measures weekly values of different suppliers for the percentage difference of waste between the layout on the computer and the actual waste when the clothing is made (called run-up). The data is in the table, and there are some negative values because sometimes the supplier is able to layout the pattern better than the computer. Do the data show that there is a difference between some of the suppliers? Test at the 1% level. Run-ups for Different Plants Making Levi Strauss Clothing Difference Plant Plant 1 11.9 Plant 1 3.9 -10.6 Plant 1 Plant 1 Plant 1 Plant 1 Plant 1 Plant 1 Plant 1 Plant 1 Plant 1 Plant 1 Plant 1 Plant 1 Plant 1 Plant 1 Plant 1 Plant 1 Plant 1 Plant 1 Plant 1 Plant 1 Plant 2 Plant 2 Plant 2 Plant 2 Plant 2 Plant 2 Plant 2 Plant 2 Plant 2 Plant 2 Plant 2 Plant 2 Plant 2 Plant 2 Plant 2 Plant 2 Plant 2 Plant 2 Plant 2 Plant 2 Plant 2 Plant 2 Plant 3 Plant 3 Plant 3 Plant 3 Plant 3 Plant 3 Plant 3…arrow_forwardSuppose the value of a stock varies each day from $10.82 to $23.17 with a uniform distribution. Find the third quartile, i.e. , 75% of all days the stock is below what value ?arrow_forwardYou are examining two data sets involving test scores, set A and set B. The score 96 appears in both data sets. In which of the following data sets does 96 represent a higher score? Explain.(a) The percentile rank of 96 is higher in set B than in set A. A. 96 represents a higher score in Set A because a larger percentage of scores fall below 96 in set A.B. 96 represents a higher score in Set B because a larger percentage of scores fall below 96 in set B. C. 96 represents an equivalent score in both sets because an equal percentage of scores fall below 96 in both sets.D. It is impossible to tell in which set 96 represents a higher score because a percentage depends on the number of test scores in the set, which is unknown. (b) The mean is 90 in both data sets, but set A has a higher standard deviation.A. 96 represents a higher score in Set A because 96 is more standard deviations above the mean.B. 96 represents a higher score in Set B because 96 is more standard deviations above the…arrow_forward
arrow_back_ios
arrow_forward_ios
Recommended textbooks for you
- MATLAB: An Introduction with ApplicationsStatisticsISBN:9781119256830Author:Amos GilatPublisher:John Wiley & Sons Inc
 Probability and Statistics for Engineering and th...StatisticsISBN:9781305251809Author:Jay L. DevorePublisher:Cengage Learning
 Statistics for The Behavioral Sciences (MindTap C...StatisticsISBN:9781305504912Author:Frederick J Gravetter, Larry B. WallnauPublisher:Cengage Learning
  Elementary Statistics: Picturing the World (7th E...StatisticsISBN:9780134683416Author:Ron Larson, Betsy FarberPublisher:PEARSON
 The Basic Practice of StatisticsStatisticsISBN:9781319042578Author:David S. Moore, William I. Notz, Michael A. FlignerPublisher:W. H. Freeman
 Introduction to the Practice of StatisticsStatisticsISBN:9781319013387Author:David S. Moore, George P. McCabe, Bruce A. CraigPublisher:W. H. Freeman
MATLAB: An Introduction with Applications
Statistics
ISBN:9781119256830
Author:Amos Gilat
Publisher:John Wiley & Sons Inc
Probability and Statistics for Engineering and th...
Statistics
ISBN:9781305251809
Author:Jay L. Devore
Publisher:Cengage Learning
Statistics for The Behavioral Sciences (MindTap C...
Statistics
ISBN:9781305504912
Author:Frederick J Gravetter, Larry B. Wallnau
Publisher:Cengage Learning
Elementary Statistics: Picturing the World (7th E...
Statistics
ISBN:9780134683416
Author:Ron Larson, Betsy Farber
Publisher:PEARSON
The Basic Practice of Statistics
Statistics
ISBN:9781319042578
Author:David S. Moore, William I. Notz, Michael A. Fligner
Publisher:W. H. Freeman
Introduction to the Practice of Statistics
Statistics
ISBN:9781319013387
Author:David S. Moore, George P. McCabe, Bruce A. Craig
Publisher:W. H. Freeman