
MATLAB: An Introduction with Applications
6th Edition
ISBN: 9781119256830
Author: Amos Gilat
Publisher: John Wiley & Sons Inc
expand_more
expand_more
format_list_bulleted
Related questions
Topic Video
Question
Part II. Complete the ANOVA table below using the study description. Answer the questions to determine if there is in fact a significant difference between the three groups.
A psychologist would like to examine the effects of sugar consumption on the activity level of preschool children. Three samples of children are selected with n = 5 in each sample. One group gets no sugar, one group gets a small dose, and the third group gets a large dose. The psychologist records the activity level for each child. The data from this experiment are presented below.
1. Compute η2 , the percentage of variance accounted for by the treatment
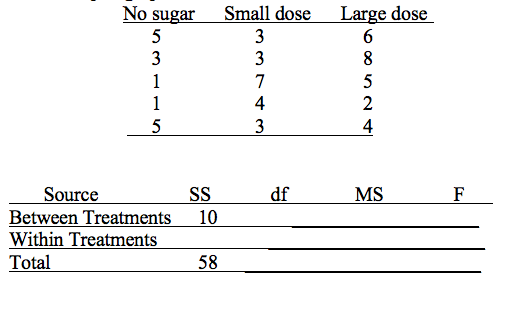

Transcribed Image Text:No sugar
Small dose
Large dose
3
3
3
4
3
4
df
Source
Between Treatments
Within Treatments
Total
SS
MS
10
58
Expert Solution
This question has been solved!
Explore an expertly crafted, step-by-step solution for a thorough understanding of key concepts.

This is a popular solution

Trending nowThis is a popular solution!

Step by stepSolved in 3 steps with 3 images

Knowledge Booster


Learn more about
Need a deep-dive on the concept behind this application? Look no further. Learn more about this topic, statistics and related others by exploring similar questions and additional content below.Similar questions
- Find the z-score and p-value.arrow_forwardRoy's Texaco wants to keep the price of its unleaded gasoline competitive with that of other stations in the area. Roy's is currently charging $1.29 per gallon. To check that the average price for this gasoline for all stations within 12-mile radius is higher than his price, Roy randomly samples the price of unleaded gasoline at ten stations located in this area. He obtains the following data for the price per gallon (in dollars): 1.7, 1.5, 2.6, 2.2, 2.4, 2.3, 2.6, 3.0, 1.4, 2.3 Set up appropriate hypotheses and test them using a significant level of .01.arrow_forwardThe stated goal of a chain of service stores is to provide a lube and oil change for anyone's automobile in 15 minutes. The manager at one store thinks that there is a growing disparity among his workers in the time it takes to lube and change the oil of an automobile. To monitor this, the manager has selected a sample of 20 days and has recorded the time it took five randomly selected employees to service an automobile. The data are found below. Complete parts a through d Click the icon to view the data. a. The manager noticed that the longest time it took to service a car was 25.73 minutes. Suppose the distribution of fimes to service a car was normal, with a mean of 15. Without analyzing the sample data, use your knowledge of a normal distribution to give the manager an estimate for the population standard deviation for the time it takes to service a car. The standard deviation is minutes. (Round to two decimal places as needed.) b. Use the data to construct an x- and an R-chart.…arrow_forward
- answer part4arrow_forwardPlease answer B, C & D.arrow_forward. Is using meditation to relax and clear the mind a natural way to treat insomnia? Design an experiment to investigate this question. Assume that you have 20 individuals who suffer from insomnia available to participate in the study. At the end of two months, you will ask subjects to rate their sleep quality.arrow_forward
- For the population of college students, the number of hours spent studying per week is normally distributed with a = 4.40 and = 2.32 hours. We surveyed a random sample of students majoring in psychology about the number of hours they spent studying this past week. The data is as follows: 6, 8, 9, 4, 3, 11, 4, 6, 5, 7 What is the dependent variable? What is the level of measurement of the dependent variable? 3. Is there a significant increase in the number of hours spent studying for our sample compared to the population of college students? Perform a complete hypothesis test (z-test) using alpha = .01 level. SHOW ALL WORKarrow_forwardStatistics Questionarrow_forwardWhat was the power for this study?arrow_forward
- You wish to determine if there is a negative linear correlation between the age of a driver and the number of driver deaths. The following table represents the age of a driver and the number of driver deaths per 100,000. Use a significance level of 0.01 and round all values to 4 decimal places. Driver Age Number of Driver Deaths per 100,000 55 20 38 21 80 32 35 20 54 29 80 31 74 79 60 18 Ho: p = 0 Ha: p=0 Find the Linear Correlation Coefficient Find the p-value p-value = The p-value is Greater than o Less than (or equal to) a The p-value leads to a decision to Do Not Reject Ho Accept Ho Reject Ho The conclusion is There is a significant positive linear correlation between driver age and number of driver deaths. There is a significant negative linear correlation between driver age and number of driver deaths. There is a significant linear correlation between driver age and number of driver deaths. There is insufficient evidence to make a conclusion about the linear correlation between…arrow_forwardThe data in the table to the right are based on the results of a survey comparing the commute time of adults to their score on a well-being test. Complete parts (a) through (d) below. LOADING... Click the icon to view the table of critical values of the correlation coefficient. a) Which variable is likely the explanatory variable and which is the response variable? Critical Values for Correlation Coefficient n 3 0.997 4 0.950 5 0.878 6 0.811 7 0.754 8 0.707 9 0.666 10 0.632 11 0.602 12 0.576 13 0.553 14 0.532 15 0.514 16 0.497 17 0.482 18 0.468 19 0.456 20 0.444 21 0.433 22 0.423 23 0.413 24 0.404 25 0.396 26 0.388 27 0.381 28 0.374 29 0.367 30 0.361 n (a) Which variable is likely the explanatory variable and which is the response variable? The explanatory variable is…arrow_forwardTwenty years ago, 56% of parents of children in high school felt it was a serious problem that high school students were not being taught enough math and science. A recent survey found that 247 of 700 parents of children in high school felt it was a serious problem that high school students were not being taught enough math and science. Do parents feel differently today than they did twenty years ago? Use the a = 0.01 level of significance. 5% of the population size, and the sample can be reasonably assumed to be random, the requirements for testing the hypothesis Because npo (1-Po) = 172.5 > 10, the sample size is less than are satisfied. (Round to one decimal place as needed.) What are the null and alternative hypotheses? 0.56 versus H,: p # 0.56 Ho: (Type integers or decimals. Do not round.) %D Find the test statistic. Zo = (Round to two decimal places as needed.) %Darrow_forward
arrow_back_ios
SEE MORE QUESTIONS
arrow_forward_ios
Recommended textbooks for you
- MATLAB: An Introduction with ApplicationsStatisticsISBN:9781119256830Author:Amos GilatPublisher:John Wiley & Sons Inc
 Probability and Statistics for Engineering and th...StatisticsISBN:9781305251809Author:Jay L. DevorePublisher:Cengage Learning
 Statistics for The Behavioral Sciences (MindTap C...StatisticsISBN:9781305504912Author:Frederick J Gravetter, Larry B. WallnauPublisher:Cengage Learning
  Elementary Statistics: Picturing the World (7th E...StatisticsISBN:9780134683416Author:Ron Larson, Betsy FarberPublisher:PEARSON
 The Basic Practice of StatisticsStatisticsISBN:9781319042578Author:David S. Moore, William I. Notz, Michael A. FlignerPublisher:W. H. Freeman
 Introduction to the Practice of StatisticsStatisticsISBN:9781319013387Author:David S. Moore, George P. McCabe, Bruce A. CraigPublisher:W. H. Freeman
MATLAB: An Introduction with Applications
Statistics
ISBN:9781119256830
Author:Amos Gilat
Publisher:John Wiley & Sons Inc
Probability and Statistics for Engineering and th...
Statistics
ISBN:9781305251809
Author:Jay L. Devore
Publisher:Cengage Learning
Statistics for The Behavioral Sciences (MindTap C...
Statistics
ISBN:9781305504912
Author:Frederick J Gravetter, Larry B. Wallnau
Publisher:Cengage Learning
Elementary Statistics: Picturing the World (7th E...
Statistics
ISBN:9780134683416
Author:Ron Larson, Betsy Farber
Publisher:PEARSON
The Basic Practice of Statistics
Statistics
ISBN:9781319042578
Author:David S. Moore, William I. Notz, Michael A. Fligner
Publisher:W. H. Freeman
Introduction to the Practice of Statistics
Statistics
ISBN:9781319013387
Author:David S. Moore, George P. McCabe, Bruce A. Craig
Publisher:W. H. Freeman