
MATLAB: An Introduction with Applications
6th Edition
ISBN: 9781119256830
Author: Amos Gilat
Publisher: John Wiley & Sons Inc
expand_more
expand_more
format_list_bulleted
Related questions
Question
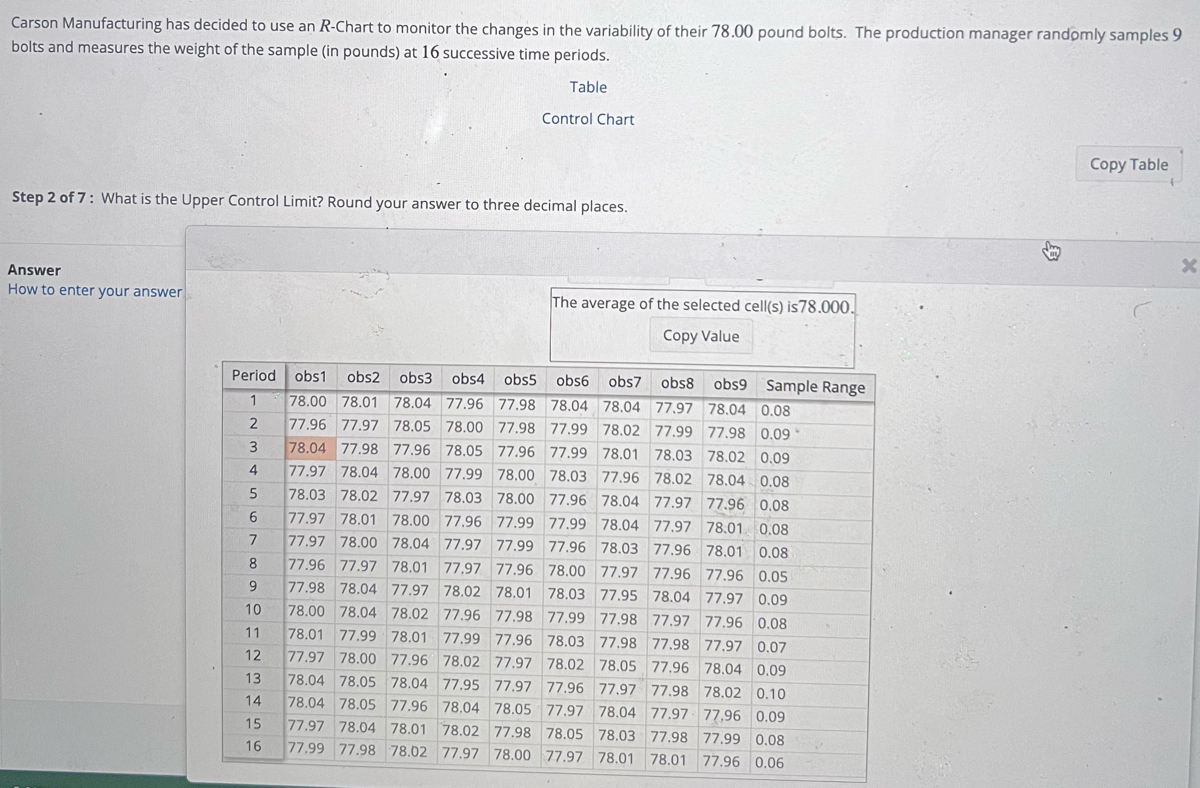

Transcribed Image Text:Carson Manufacturing has decided to use an R-Chart to monitor the changes in the variability of their 78.00 pound bolts. The production manager randomly samples 9
bolts and measures the weight of the sample (in pounds) at 16 successive time periods.
Table
Step 2 of 7: What is the Upper Control Limit? Round your answer to three decimal places.
Answer
How to enter your answer
Period
1
2
3
4
5
6
obs1 obs2 obs3 obs4 obs5 obs6 obs7 obs8 obs9 Sample Range
78.00 78.01 78.04 77.96 77.98 78.04 78.04 77.97 78.04 0.08
77.96 77.97 78.05 78.00 77.98 77.99 78.02 77.99 77.98 0.09
78.04 77.98 77.96 78.05 77.96 77.99 78.01 78.03 78.02 0.09
77.97 78.04 78.00 77.99 78.00 78.03 77.96 78.02 78.04 0.08
78.03 78.02 77.97 78.03 78.00 77.96 78.04 77.97 77.96 0.08
77.97 78.01 78.00 77.96 77.99 77.99 78.04 77.97 78.01 0.08
77.97 78.00 78.04 77.97
77.96 77.97 78.01 77.97 77.96 78.00
77.98 78.04 77.97 78.02 78.01 78.03
10 78.00 78.04 78.02 77.96 77.98 77.99
11 78.01 77.99 78.01 77.99 77.96 78.03 77.98
77.97 78.00 77.96 78.02 77.97 78.02 78.05
78.04 78.05 78.04 77.95 77.97 77.96 77.97 77.98 78.02 0.10
78.04 78.05 77.96 78.04 78.05 77.97 78.04 77.97 77,96 0.09
15 77.97 78.04 78.01 78.02 77.98 78.05 78.03 77.98 77.99 0.08
16 77.99 77.98 78.02 77.97 78.00 77.97 78.01 78.01 77.96 0.06
77.99 77.96 78.03 77.96 78.01 0.08
77.97 77.96 77.96 0.05
77.95 78.04 77.97 0.09
77.98 77.97 77.96 0.08
77.98 77.97 0.07
77.96 78.04 0.09
7
8
9
PANENSK
12
Control Chart
13
14
The average of the selected cell(s) is 78.000.
Copy Value
Copy Table
x
Expert Solution
This question has been solved!
Explore an expertly crafted, step-by-step solution for a thorough understanding of key concepts.

This is a popular solution

Trending nowThis is a popular solution!

Step by stepSolved in 3 steps with 7 images

Knowledge Booster

Similar questions
- In a student survey, fifty-two part-time students were asked how many courses they were taking this term. The (incomplete) results are shown below: Please round your answer to 4 decimal places for the Relative Frequency if possible. # of Courses Frequency Relative Frequency Cumulative Frequency 1 0.3269 17 2 19 0.3654 36 3 16 What percent of students take exactly one courses? %arrow_forwardThe following histogram shows the exam scores for the pre algebra class. Use this histogram to answer the questions. Find the class width for this histogram.arrow_forwardEyeglassomatic manufactures eyeglasses for different retailers. They test to see how many defective lenses they made the time period of January 1 to March 31. The table gives the defect and the number of defects. Do the data support the notion that each defect type occurs in the same proportion? Test at the 5% level. Number of Defective Lenses Defect type Number of defects Scratch 1866 Right shaped - small 1935 Flaked 1979 Wrong axis 1921 Chamfer wrong 1864 Crazing, cracks 1991 Wrong shape 2004 Wrong PD 1895 Spots and bubbles 1917 Wrong height 1885 Right shape - big 1875 Lost in lab 1886 Spots/bubble - intern 1935 State the hypotheses.H0: Each defect type in the same proportion.Ha: Each defect type in the same proportion. Calculate the χ2 test statistic. Round expected values to two decimal places. Round χ2 to three decimal places.χ2 = Calculate the p-value. Round to four decimal places.p-value = State your decision.Since p-value 0.05,…arrow_forward
- Consider the following partially filled frequency table: Value Frequency 0.5 1.0 2.9 Calculate the mean (to 2 d.p.). Cumulative Relative Frequency Frequency 0.2 39 100arrow_forwardUse the following cell phone airport data speeds (Mbps) from a particular network. Find the percentile corresponding to the data speed 0.9 Mbps. Percentile of 0.9 equals (Round to the nearest whole number as needed.)arrow_forwardConsider the following table: SS DF MS ? Among Treatments 4468.45 Error Total Step 2 of 8: Calculate the degrees of freedom among treatments. 10 706.87 15 LL Farrow_forward
- Listed below are the measured radiation absorption rates ( in 5 - number summary . W/kg) corresponding to 11 cell phones . Use the given data to construct a boxplot and identify the 1.49,1.25, 1.38, 1.04, 1.46, 1.31, 1.28, 0.73, 1.41, 0.58, 1.36arrow_forwardUsing the given data, find the following. 6.8, 15.2, 16.2, 7.4, 18.3, 5.6, 13.5, 11.3, 4.6, 9.7 Send data to Excel Part: 0 / 2 Part 1 of 2 Identify the five-number summary. Round your answers to one decimal place as needed. 0.e,-0, MD =D, e,=D, High = Q3 Low =arrow_forwardI'm not sure where is my mistake solving this problem. I have revised my calculation three times already and I'm not sure if the step to solve it is wrong or if it is my rounding the problem. Thank you for your helparrow_forward
arrow_back_ios
arrow_forward_ios
Recommended textbooks for you
- MATLAB: An Introduction with ApplicationsStatisticsISBN:9781119256830Author:Amos GilatPublisher:John Wiley & Sons Inc
 Probability and Statistics for Engineering and th...StatisticsISBN:9781305251809Author:Jay L. DevorePublisher:Cengage Learning
 Statistics for The Behavioral Sciences (MindTap C...StatisticsISBN:9781305504912Author:Frederick J Gravetter, Larry B. WallnauPublisher:Cengage Learning
  Elementary Statistics: Picturing the World (7th E...StatisticsISBN:9780134683416Author:Ron Larson, Betsy FarberPublisher:PEARSON
 The Basic Practice of StatisticsStatisticsISBN:9781319042578Author:David S. Moore, William I. Notz, Michael A. FlignerPublisher:W. H. Freeman
 Introduction to the Practice of StatisticsStatisticsISBN:9781319013387Author:David S. Moore, George P. McCabe, Bruce A. CraigPublisher:W. H. Freeman
MATLAB: An Introduction with Applications
Statistics
ISBN:9781119256830
Author:Amos Gilat
Publisher:John Wiley & Sons Inc
Probability and Statistics for Engineering and th...
Statistics
ISBN:9781305251809
Author:Jay L. Devore
Publisher:Cengage Learning
Statistics for The Behavioral Sciences (MindTap C...
Statistics
ISBN:9781305504912
Author:Frederick J Gravetter, Larry B. Wallnau
Publisher:Cengage Learning
Elementary Statistics: Picturing the World (7th E...
Statistics
ISBN:9780134683416
Author:Ron Larson, Betsy Farber
Publisher:PEARSON
The Basic Practice of Statistics
Statistics
ISBN:9781319042578
Author:David S. Moore, William I. Notz, Michael A. Fligner
Publisher:W. H. Freeman
Introduction to the Practice of Statistics
Statistics
ISBN:9781319013387
Author:David S. Moore, George P. McCabe, Bruce A. Craig
Publisher:W. H. Freeman