MATLAB: An Introduction with Applications
6th Edition
ISBN: 9781119256830
Author: Amos Gilat
Publisher: John Wiley & Sons Inc
expand_more
expand_more
format_list_bulleted
Concept explainers
Question
thumb_up100%
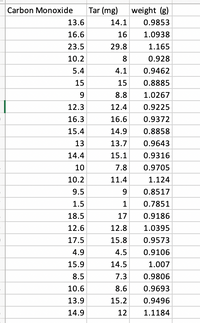
Which is a better predictor of the amount of tar in a cigarette? The amout of carbon monoxide in the cigarette or the weight of the cigarette? Support your answer using approprate statistics.

Transcribed Image Text:Carbon Monoxide
Tar (mg)
weight (g)
13.6
14.1
0.9853
16.6
16
1.0938
23.5
29.8
1.165
10.2
8
0.928
5.4
4.1
0.9462
15
15
0.8885
9
8.8
1.0267
12.3
12.4
0.9225
16.3
16.6
0.9372
15.4
14.9
0.8858
13
13.7
0.9643
14.4
15.1
0.9316
10
7.8
0.9705
10.2
11.4
1.124
9.5
9.
0.8517
1.5
0.7851
18.5
17
0.9186
12.6
12.8
1.0395
17.5
15.8
0.9573
4.9
4.5
0.9106
15.9
14.5
1.007
8.5
7.3
0.9806
10.6
8.6
0.9693
13.9
15.2
0.9496
14.9
12
1.1184
Expert Solution
This question has been solved!
Explore an expertly crafted, step-by-step solution for a thorough understanding of key concepts.
Step by stepSolved in 2 steps with 4 images

Knowledge Booster
Learn more about
Need a deep-dive on the concept behind this application? Look no further. Learn more about this topic, statistics and related others by exploring similar questions and additional content below.Similar questions
- K The data found below measure the amounts of greenhouse gas emissions from three types of vehicles. The measurements are in tons per year, expressed as CO2 equivalents. Use a 0.05 significance level to test the claim that the different types of vehicle have the same mean amount of greenhouse gas emissions. Based on the results, does the type of vehicle appear to affect the amount of greenhouse gas emissions? Click the icon to view the data. O search F4 OA. Ho: H₁ H₂ H3 H₁ H₁ H₂ H3 OB. Ho H₁ H₂=13 H₁: At least one of the means is different from the others. OC. Ho: 1₁ =1₂2=43 H₁ H₁ H₂ H3 OD. Ho: At least one of the means is different from the others. H₁: Hy=4₂=13 Determine the test statistic. F= (Round to two decimal places as needed.) Identify the P-value. P-value = (Round to two decimal places as needed.) What is the conclusion of the test? F5 the null hypothesis. Conclude that the type of vehicle O F6 II F7 F8 1 F9 X *( acer F10 Data Table F11 Type A 6.3 6.9 F12 6.6 6.2 6.7 7.1 7.8…arrow_forwardaChen -. M Gmail YouTube Maps oscar - Google D... Translate New Tab ece Gler 2/6 100% SID: 2. A researcher is studying the relationship between various properties of wine and their taste characteristics. The histogram below shows the amount of residual sugar (sugar left after fermentation) in a collection of wines. However, one of the bars, between 3 and 5 grams per liter, is missing. 50 (47.9) (38.7) 30 10 (0.1) (0.92) (0.1) 2 10 15 Residual sugar (grams/liter) Calculate the height of the missing bar and draw it in. (Show your work below, and indicate the numerical value in parentheses above the bar.) % per gramlterarrow_forwardAnswer the question. Show all the steps, not only the final answer. if possible, sketch a little diagram to clearly see the area under the normal curve. 1. A major research study concluded that the mean number of times that adolescents had engaged in vandalism during the previous 12 months was 3.5 times. We believe the true population mean to be less than this. After collecting our own sample of 36 adolescents, we find that the mean number of times they have vandalized property during a l-year period wasX̅ = 2.9 with a standard deviation equal to .7. Perform all ofthe procedures necessary for conducting a hypothesis test based on our assumption. What do you conclude? Set your alpha level at .05.arrow_forward
- Please answer d and e.arrow_forward0.05 level of significance. Solve for appropriate test statistic and show written work!arrow_forwardUsing the same data as question 4 (included below), determine the coefficient of determination. Report your answer with 4 significant figures. Y 4.99 22.19 1.96 9.89 2.98 11 40.46 4.04 18.93 6.06 25 0.88 0.19 8.02 34.02 6.97 28.03arrow_forward
arrow_back_ios
arrow_forward_ios
Recommended textbooks for you
 MATLAB: An Introduction with ApplicationsStatisticsISBN:9781119256830Author:Amos GilatPublisher:John Wiley & Sons Inc
 Probability and Statistics for Engineering and th...StatisticsISBN:9781305251809Author:Jay L. DevorePublisher:Cengage Learning
 Statistics for The Behavioral Sciences (MindTap C...StatisticsISBN:9781305504912Author:Frederick J Gravetter, Larry B. WallnauPublisher:Cengage Learning
 Elementary Statistics: Picturing the World (7th E...StatisticsISBN:9780134683416Author:Ron Larson, Betsy FarberPublisher:PEARSON
 The Basic Practice of StatisticsStatisticsISBN:9781319042578Author:David S. Moore, William I. Notz, Michael A. FlignerPublisher:W. H. Freeman
 Introduction to the Practice of StatisticsStatisticsISBN:9781319013387Author:David S. Moore, George P. McCabe, Bruce A. CraigPublisher:W. H. Freeman

MATLAB: An Introduction with Applications
Statistics
ISBN:9781119256830
Author:Amos Gilat
Publisher:John Wiley & Sons Inc

Probability and Statistics for Engineering and th...
Statistics
ISBN:9781305251809
Author:Jay L. Devore
Publisher:Cengage Learning

Statistics for The Behavioral Sciences (MindTap C...
Statistics
ISBN:9781305504912
Author:Frederick J Gravetter, Larry B. Wallnau
Publisher:Cengage Learning

Elementary Statistics: Picturing the World (7th E...
Statistics
ISBN:9780134683416
Author:Ron Larson, Betsy Farber
Publisher:PEARSON

The Basic Practice of Statistics
Statistics
ISBN:9781319042578
Author:David S. Moore, William I. Notz, Michael A. Fligner
Publisher:W. H. Freeman

Introduction to the Practice of Statistics
Statistics
ISBN:9781319013387
Author:David S. Moore, George P. McCabe, Bruce A. Craig
Publisher:W. H. Freeman