
ENGR.ECONOMIC ANALYSIS
14th Edition
ISBN: 9780190931919
Author: NEWNAN
Publisher: Oxford University Press
expand_more
expand_more
format_list_bulleted
Related questions
Question
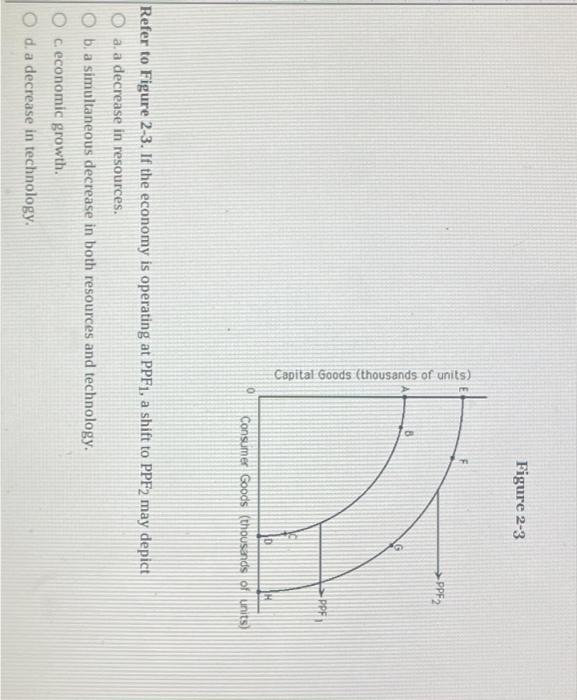

Transcribed Image Text:Capital Goods (thousands of units)
Oc economic growth.
O d. a decrease in technology.
Figure 2-3
B
Refer to Figure 2-3. If the economy is operating at PPF1, a shift to PPF2 may depict
a. a decrease in resources.
b. a simultaneous decrease in both resources and technology.
PPF2
Consumer Goods (thousands of units)
Expert Solution
This question has been solved!
Explore an expertly crafted, step-by-step solution for a thorough understanding of key concepts.

This is a popular solution

Trending nowThis is a popular solution!

Step by stepSolved in 4 steps

Knowledge Booster


Learn more about
Need a deep-dive on the concept behind this application? Look no further. Learn more about this topic, economics and related others by exploring similar questions and additional content below.Similar questions
- Hi I need the Answers to this question please thank youarrow_forward3/25/22, 10:54 PM Assignment Print View 3. The graphs below show the production possibilities frontiers for apples and peaches in Italy and Turkey. (i Italy's Production Possibilities 4.0 3.6 3.2 2.8 A 2.4 2.0 1.6 1.2 0.8 0.4 Peaches (millions of tons) https://ezto.mheducation.com/hm.tpx?todo=c15SinglePrintView&singleQuestionNo=3.&postSubmissionView=13252718360410217&wid=13252718466068729&rol... 1/3 5.2 4.8 4.4 Y4.0 3.6 3.2 2.8 2.4 2.0 1.6 0.8 0.4 Apples (millions of tons)arrow_forwardAs the economy recovers from a recession, a decrease in the cyclical unemployment rate A. shifts the PPF outward. OB. moves the economy from a point inside the PPF to a point closer to or on the PPF. OC. shifts the PPF inward. O D. moves the economy from a point on the PPF to a point inside the PPF. OE. moves the economy's point of production along the PPF. ***arrow_forward
- 1. Consider a simple example economy where there are three companies. Gelato Inc. is an Italian company that produces ice cream; it is located in St. Louis but owned by an Italian chemist who sends from time to time secret formulas for new flavors. Milky Way is a milk producer in the St. Louis area. Finally, Sweetyou is a sugar producer, also located in St. Louis. In 2019, Gelato Inc. produced and sold to consumers $500 worth of ice cream, using $50 of sugar and $100 of milk. It also paid $150 in wages and $50 in taxes. Milky Way produced $200 worth of milk. It sold $100 to Gelato Inc. and $100 to the consumers. It paid $100 in wages, $20 in interests on a previous loan, and $30 in taxes. Sweetyou produced $200 worth of sugar, of which $50 was sold to Gelato Inc., $100 was exported to France, and the remaining was unsold. Sweetyou paid wages for $100 and $40 in taxes. The government in this St. Louis based economy provides public services for which it employs labor and basic income for…arrow_forward!arrow_forward
arrow_back_ios
arrow_forward_ios
Recommended textbooks for you
 Principles of Economics (12th Edition)EconomicsISBN:9780134078779Author:Karl E. Case, Ray C. Fair, Sharon E. OsterPublisher:PEARSON
 Engineering Economy (17th Edition)EconomicsISBN:9780134870069Author:William G. Sullivan, Elin M. Wicks, C. Patrick KoellingPublisher:PEARSON
 Principles of Economics (MindTap Course List)EconomicsISBN:9781305585126Author:N. Gregory MankiwPublisher:Cengage Learning
 Managerial Economics: A Problem Solving ApproachEconomicsISBN:9781337106665Author:Luke M. Froeb, Brian T. McCann, Michael R. Ward, Mike ShorPublisher:Cengage Learning
 Managerial Economics & Business Strategy (Mcgraw-...EconomicsISBN:9781259290619Author:Michael Baye, Jeff PrincePublisher:McGraw-Hill Education
Principles of Economics (12th Edition)
Economics
ISBN:9780134078779
Author:Karl E. Case, Ray C. Fair, Sharon E. Oster
Publisher:PEARSON
Engineering Economy (17th Edition)
Economics
ISBN:9780134870069
Author:William G. Sullivan, Elin M. Wicks, C. Patrick Koelling
Publisher:PEARSON
Principles of Economics (MindTap Course List)
Economics
ISBN:9781305585126
Author:N. Gregory Mankiw
Publisher:Cengage Learning
Managerial Economics: A Problem Solving Approach
Economics
ISBN:9781337106665
Author:Luke M. Froeb, Brian T. McCann, Michael R. Ward, Mike Shor
Publisher:Cengage Learning
Managerial Economics & Business Strategy (Mcgraw-...
Economics
ISBN:9781259290619
Author:Michael Baye, Jeff Prince
Publisher:McGraw-Hill Education