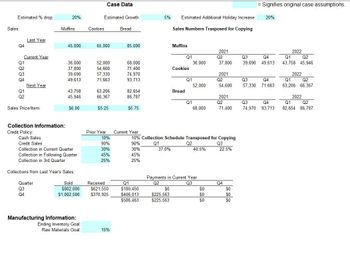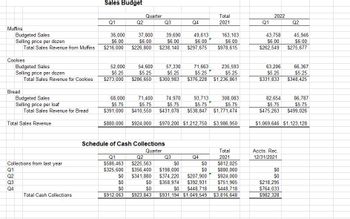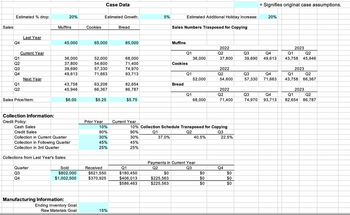
Frenchies is a medium-sized regional bakery that specializes in providing orders to grocery and convenience stores. Because of the popularity of its brand, it has also opened a small café for walk-in business. In order to maintain its high quality standard, Frenchies produces only three products: breakfast muffins, fresh bread, and chocolate chip cookies. Although business has been good in the past few years, a lucky contact with a large chain has recently allowed it to expand its brand out of the local region. Growth has been high since the new contract went into effect. In 2020, Frenchies sold 45,000 one-dozen packages of muffins for $5.50 each, 65,000 one-dozen packages of cookies for $4.75 each, and 85,000 one-dozen loaves of bread for $5.25 each. They will raise prices to $6.00 for muffins, $5.25 for cookies, and $5.75 for bread for 2021. Sales will drop some in the first quarter of 2021. They always drop off a bit after the holidays anyway, but with the increase in sales prices, a 20 percent drop from the fourth quarter of 2020 results is
1. General impression/ recommendations for the company after analyzing the budget?


Trending nowThis is a popular solution!
Step by stepSolved in 2 steps

Frenchies is a medium-sized regional bakery that specializes in providing orders to grocery and convenience stores. Because of the popularity of its brand, it has also opened a small café for walk-in business. In order to maintain its high quality standard, Frenchies produces only three products: breakfast muffins, fresh bread, and chocolate chip cookies. Although business has been good in the past few years, a lucky contact with a large chain has recently allowed it to expand its brand out of the local region. Growth has been high since the new contract went into effect. In 2020, Frenchies sold 45,000 one-dozen packages of muffins for $5.50 each, 65,000 one-dozen packages of cookies for $4.75 each, and 85,000 one-dozen loaves of bread for $5.25 each. They will raise prices to $6.00 for muffins, $5.25 for cookies, and $5.75 for bread for 2021. Sales will drop some in the first quarter of 2021. They always drop off a bit after the holidays anyway, but with the increase in sales prices, a 20 percent drop from the fourth quarter of 2020 results is
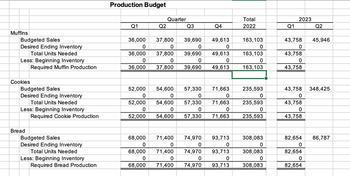
With the information above, how does it translate into the a Production Budget Plan as shown in one of the images?


Can you show the formulas in the cells please?
Frenchies is a medium-sized regional bakery that specializes in providing orders to grocery and convenience stores. Because of the popularity of its brand, it has also opened a small café for walk-in business. In order to maintain its high quality standard, Frenchies produces only three products: breakfast muffins, fresh bread, and chocolate chip cookies. Although business has been good in the past few years, a lucky contact with a large chain has recently allowed it to expand its brand out of the local region. Growth has been high since the new contract went into effect. In 2020, Frenchies sold 45,000 one-dozen packages of muffins for $5.50 each, 65,000 one-dozen packages of cookies for $4.75 each, and 85,000 one-dozen loaves of bread for $5.25 each. They will raise prices to $6.00 for muffins, $5.25 for cookies, and $5.75 for bread for 2021. Sales will drop some in the first quarter of 2021. They always drop off a bit after the holidays anyway, but with the increase in sales prices, a 20 percent drop from the fourth quarter of 2020 results is
With the information above, how does it translate into the a Production Budget Plan as shown in one of the images?


Can you show the formulas in the cells please?
- Proctor & Gamble (PG) and Church & Dwight (CHD) are two iconic American consumer products companies with histories dating back to the mid-1800s and producing familiar products such as Tide, Bounty, Crest, Arm and Hammer, OxiClean, and Waterpik. Both companies primarily sell their products to retailers such as grocery stores, drug stores and other mass merchants In evaluating the two companies, it was determined that PG is approximately 15 times larger than CHD based on sales. A convenient way to analyze financial results when companies are of different sizes is through ratio analysis. Obtain the financial statements of PG for the year ended June 30, 2021, and CHD for the year ended December 31, 2021, and compute the following ratios for both companies. 1. Accounts receivable turnover for 2021 2. Inventory turnover for 2021 3. P/E (price/earnings) ratio using the 2021 diluted EPS and the most current stock price of the company (attach a screenshot of the current stock price…arrow_forwardSalamander Inc. is a food processing company that operates divisions in three major lines of food products: cereals, frozen fish, and candy. On 13 September 20X1, the Board of Directors voted to put the candy division up for sale. The candy division's operating results had been declining for the past several years due to intense competition from large international players such as Nestlé and Cadbury. The Board hired the consulting firm Atelier LLP to conduct a search for potential buyers. The consulting fee was to be 5% of the value of any sale transaction. By 31 December 20X1, Atelier had found a highly interested buyer for the candy division, and serious negotiations were underway. The buyer was a food conglomerate based in Brazil; it offered $6.1 million cash. On 25 February 20X2, after further negotiations, the Salamander's board accepted an enhanced Brazilian offer to buy the division for $6.4 million. The Salamander shareholders approved the sale on 5 March 20X2. The transfer of…arrow_forwardWith the goal of attracting as much customers as possible in the CALABARZON region, JHET COMPANY engaged in a customer satisfaction program and marketing strategy for two of their major lines of products: (1) electrical appliances and (2) household and office furniture. All branches in the region are participating in the company’s promotions. In the customer satisfaction program, JHET provides one-year warranty replacement of parts and labor of the electrical appliances sold. Based on past experience, the estimated warranty cost is 3% of sales. During 2021, total sales of electrical appliances was ₱7,200,000. Replacement parts and labor for warranty work totaled ₱184,000 during 2021. In the company’s marketing strategy for the household and office furniture section, customers are given a coupon for every ₱1,000 spent on these items. Customers may exchange 10 coupons plus ₱500 for a “hot and cold” water dispenser. Each water dispenser cost ₱1,200 and estimates that 40% of the coupons…arrow_forward
- N1. Account .arrow_forwardZynex Co manufactures a range of electronic devices, which it sells to online stores and retail outlets. It has a risk-seeking attitude and its objective is to maximise profit. Six months ago it released a new version of its smartphone, the ZV. Zynex Co's main smartphone competitor has announced that it will launch a new version of its smartphone in one month's time and Zynex Co is concerned about the effect of the launch of this rival product on future demand for the ZV. For each of the previous ten smartphones launched by its competitors, Zynex Co's marketing team has analysed the impact on Zynex Co's sales performance. This data was retained specifically for the purpose of forecasting future demand of Zynex Co's smartphones and is stored in the company's financial database. Based on this analysis, the marketing team has identified three possible outcomes for the impact on the demand of the ZV: a small decrease, a medium decrease and a large decrease. Production volumes for the ZV…arrow_forwardStark and Company is a manufacturer that sells robots predominantly in the Asian market. Times have been tough for the auto industry and Stark and Company is no different. The company is under tremendous pressure to turn a profit. Several years ago, as analysts were predicting a large downturn in the robot industry, Stark decided to purchase a smaller niche robot maker in the hopes of capturing a different segment of the consumer market and to better learn the manufacturing processes of other robot makers. Starks still operates as two separate divisions, Classic and New Age, with each division manager employing a different manufacturing philosophy. The Classic manager is concerned with low input costs and quantity in production in addition to brand recognition and robot power. The New Age manager is concerned with quality and innovation in manufacturing, fuel-efficient and environmentally friendly robots. SAC continued to suffer losses even with the addition of the New Age division.…arrow_forward
- Ameen trading company is a popular distributor in the Nizwa region having years of experience in the field of logisties and marketing. Over these years, the company has gained a very good public opinion and quiet a big number of loyal customers. During the last year, the company has faced some financial struggles due to the pandemic - crisis. The company has decided to plan well for the current year based on the past performance so that the company will be able to regain its status. The management of the company has given with you the Income statement for the last year and asked you to calculate the gross profit and net profit margin. Partkular OMR Particular OMR Opening Stock Purchases Carriage and Freight Wages Gross Profit bd To 76,250 By Sales 315 250 "Closing stock 2,000 5,000 2,00,000 5,98500 1,01,000 By Gross Profit b/d 12000 Non-operating incomes 2,000 7 p00 *Dividend on shares 84 000 Profit on sale of shares 2,06,000 5,00,000 98,500 5,98,500 2,00,000 To Administration expenses…arrow_forwardExeter Group is a large retail company that has brick-and-mortar outlets throughout the Southeast. They have been in business for many years, but two years ago started an online sales channel to offset slowing in-store sales. The human resources (HR) department at Exeter handles tasks for the two divisions that make up Exeter: Retail and Online. Retail Division manages the company’s traditional business line. This business, although still profitable, is currently not growing and may be shrinking slightly. Online Division, on the other hand, has experienced double-digit growth from the beginning. The cost allocation system at Exeter allocates all corporate costs to the divisions based on a variety of cost allocation bases. HR costs are allocated based on the average number of employees in the two divisions. There are two basic activities in the HR Department. The first is employee maintenance (payroll administration, benefits, and so on), which is an ongoing activity and requires the…arrow_forwardLet us look at brewary Ipana Oy's operating systems. Ipana Oy has found some potential long-time partners in the restaurant business. To optimize the supply chain, the company is negotiating for contracts that would allow all production in the coming years to be sold to these partners. The contracts aim to shift production to 20 liter barrels of beer, which would become the sole product of Ipana Oy. In case the negotiations are successful, Ipana Oy estimates its typical year would look as follows: the quantity shipped to the customer is 18000 units at a price of 300 €/unit. The gross profit percentage is 40 % and the yearly fixed costs are 1500000 €. 1. Calculate the variable cost per unit [€/unit] for products that would be produced in the scenario above.( ) 2.Calculate the critical sales price in the estimate [€/product]. ( ) 3.Calculate the EBITDA (earnings before interests, taxes, depreciations and amortizations) of a typical year. Give your answer to the nearest thousand…arrow_forward

 AccountingAccountingISBN:9781337272094Author:WARREN, Carl S., Reeve, James M., Duchac, Jonathan E.Publisher:Cengage Learning,
 Accounting Information SystemsAccountingISBN:9781337619202Author:Hall, James A.Publisher:Cengage Learning,
 Horngren's Cost Accounting: A Managerial Emphasis...AccountingISBN:9780134475585Author:Srikant M. Datar, Madhav V. RajanPublisher:PEARSON
 Intermediate AccountingAccountingISBN:9781259722660Author:J. David Spiceland, Mark W. Nelson, Wayne M ThomasPublisher:McGraw-Hill Education
 Financial and Managerial AccountingAccountingISBN:9781259726705Author:John J Wild, Ken W. Shaw, Barbara Chiappetta Fundamental Accounting PrinciplesPublisher:McGraw-Hill Education


