Human Anatomy & Physiology (11th Edition)
11th Edition
ISBN: 9780134580999
Author: Elaine N. Marieb, Katja N. Hoehn
Publisher: PEARSON
expand_more
expand_more
format_list_bulleted
Question

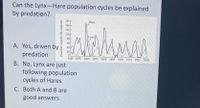
Transcribed Image Text:**Exploring the Lynx-Hare Population Cycles**
**Can the Lynx-Hare population cycles be explained by predation?**
**A.** Yes, driven by predation
**B.** No, Lynx are just following population cycles of Hares
**C.** Both A and B are good answers
**Graph Analysis:**
The graph illustrates the population cycles of lynx and hares from 1845 to 1935, as measured by the number of pelts (in thousands).
- **Y-Axis:** Number of pelts in thousands
- **X-Axis:** Year (spanning from 1845 to 1935)
- The graph displays two lines:
- **Hare (Bold Line):** Shows significant peaks approximately every 10 years, indicating population booms.
- **Lynx (Thin Line):** Follows the hare pattern but with a slight lag, suggesting their population is influenced by the availability of hares.
**Conclusion:** The observed data suggests a cyclical pattern where hare populations boom and bust, followed by corresponding changes in lynx populations. This relationship points to predation as a significant factor, as lynx numbers increase with abundant hare prey and decline when hare numbers fall. Both predation and the natural cycles of hare populations contribute to the phenomena observed.
Expert Solution
This question has been solved!
Explore an expertly crafted, step-by-step solution for a thorough understanding of key concepts.
This is a popular solution
Trending nowThis is a popular solution!
Step by stepSolved in 2 steps

Knowledge Booster
Similar questions
- Populations that have reduced variation in their vital rates in response to increasing environmental variation are said to have а. Environmental stochasticity O b. Temporal autocorrelation С. Demographic buffering O d. Unstable equilibrium O e. Stable equilibriumarrow_forwardA researcher decides to try to incorporate stochasticity by changing carrying capacity (K) in the logistic model over time. This would be best considered а. Noise O b. Demographic heterogeneity С. This is not stochasticity O d. Demographic stochasticity O e. Environmental stochasticityarrow_forwardThe greater sage grouse is a bird that lives on the Canadian prairies and is considered to be a species at risk. In 2001, 108 male greater sage grouse were counted in breeding sites in Alberta. In 2012, 13 male greater sage grouse were counted in the breeding sites. The per capita growth rate of the population of greater sage grouse in Alberta between 2001 and 2012 was? Select one: a. 7.3 b. 0.9 c. -0.9 d. -7.3arrow_forward
- Based on the data below, which of the following statements best describes an effect of population density on mice populations: Number of Ave. Ave. Ratio of mice percent of number of male: successful mice per female breeding litter 50 60% 7.2 1:2 148 58% 6.8 1:2 374 57% 6.6 1:2 1700 39% 5.2 1:2 a. Successful breeding decrease as population density decreases. b. the female to male ratio increases a population density decreases O c. Successful breeding decrease as population density increases d. Birthrate decreases as population density increasesarrow_forwardstochasticity is a result of I temporal variation in demographic rates O a. demographic O b. environmental and demographic C. sex-bias O d. environmentalarrow_forwardIf the deer population is decreasing what would you expect to happen to the wolf population? Why?arrow_forward
- C 100- 80- % Diet presence absence Catch-effort H ဗုံ Refer to the figure. Gulls increase their consumption of fish in the A Fish abundance B Mussel growth 15 of sea otters. Sea otters Present Absent D Gulls % Diet 60- B 40- F M 20- mm yr¹ Bald eagles B M 10-arrow_forwardA population has 1000 juvenile individuals, 100 young adult individuals, and 10 older adult individuals. This population is likely…? Group of answer choices a, increasing b. decreasing c. stable d. no way to tellarrow_forwardAnswer this correctly and QUICKLY PLSarrow_forward
- 1arrow_forwardWhich statement is true about overpopulation? O A. Overpopulation increases resource availability. O B. Overpopulation is linked to decreased disease. C. Overpopulation occurs more frequently in developed areas of the world. D. Overpopulation results in increased waste and environmental pollution. 4 of 10 Answered MacBook Air 딤 FS 담 FA esc F2 # 2$ & 2 3 4 6 7 8 W R Y A S F G Harrow_forward
arrow_back_ios
arrow_forward_ios
Recommended textbooks for you
 Human Anatomy & Physiology (11th Edition)BiologyISBN:9780134580999Author:Elaine N. Marieb, Katja N. HoehnPublisher:PEARSON
 Biology 2eBiologyISBN:9781947172517Author:Matthew Douglas, Jung Choi, Mary Ann ClarkPublisher:OpenStax
 Anatomy & PhysiologyBiologyISBN:9781259398629Author:McKinley, Michael P., O'loughlin, Valerie Dean, Bidle, Theresa StouterPublisher:Mcgraw Hill Education,
 Molecular Biology of the Cell (Sixth Edition)BiologyISBN:9780815344322Author:Bruce Alberts, Alexander D. Johnson, Julian Lewis, David Morgan, Martin Raff, Keith Roberts, Peter WalterPublisher:W. W. Norton & Company
 Laboratory Manual For Human Anatomy & PhysiologyBiologyISBN:9781260159363Author:Martin, Terry R., Prentice-craver, CynthiaPublisher:McGraw-Hill Publishing Co.
 Inquiry Into Life (16th Edition)BiologyISBN:9781260231700Author:Sylvia S. Mader, Michael WindelspechtPublisher:McGraw Hill Education

Human Anatomy & Physiology (11th Edition)
Biology
ISBN:9780134580999
Author:Elaine N. Marieb, Katja N. Hoehn
Publisher:PEARSON

Biology 2e
Biology
ISBN:9781947172517
Author:Matthew Douglas, Jung Choi, Mary Ann Clark
Publisher:OpenStax

Anatomy & Physiology
Biology
ISBN:9781259398629
Author:McKinley, Michael P., O'loughlin, Valerie Dean, Bidle, Theresa Stouter
Publisher:Mcgraw Hill Education,

Molecular Biology of the Cell (Sixth Edition)
Biology
ISBN:9780815344322
Author:Bruce Alberts, Alexander D. Johnson, Julian Lewis, David Morgan, Martin Raff, Keith Roberts, Peter Walter
Publisher:W. W. Norton & Company

Laboratory Manual For Human Anatomy & Physiology
Biology
ISBN:9781260159363
Author:Martin, Terry R., Prentice-craver, Cynthia
Publisher:McGraw-Hill Publishing Co.

Inquiry Into Life (16th Edition)
Biology
ISBN:9781260231700
Author:Sylvia S. Mader, Michael Windelspecht
Publisher:McGraw Hill Education