
ENGR.ECONOMIC ANALYSIS
14th Edition
ISBN: 9780190931919
Author: NEWNAN
Publisher: Oxford University Press
expand_more
expand_more
format_list_bulleted
Related questions
Question
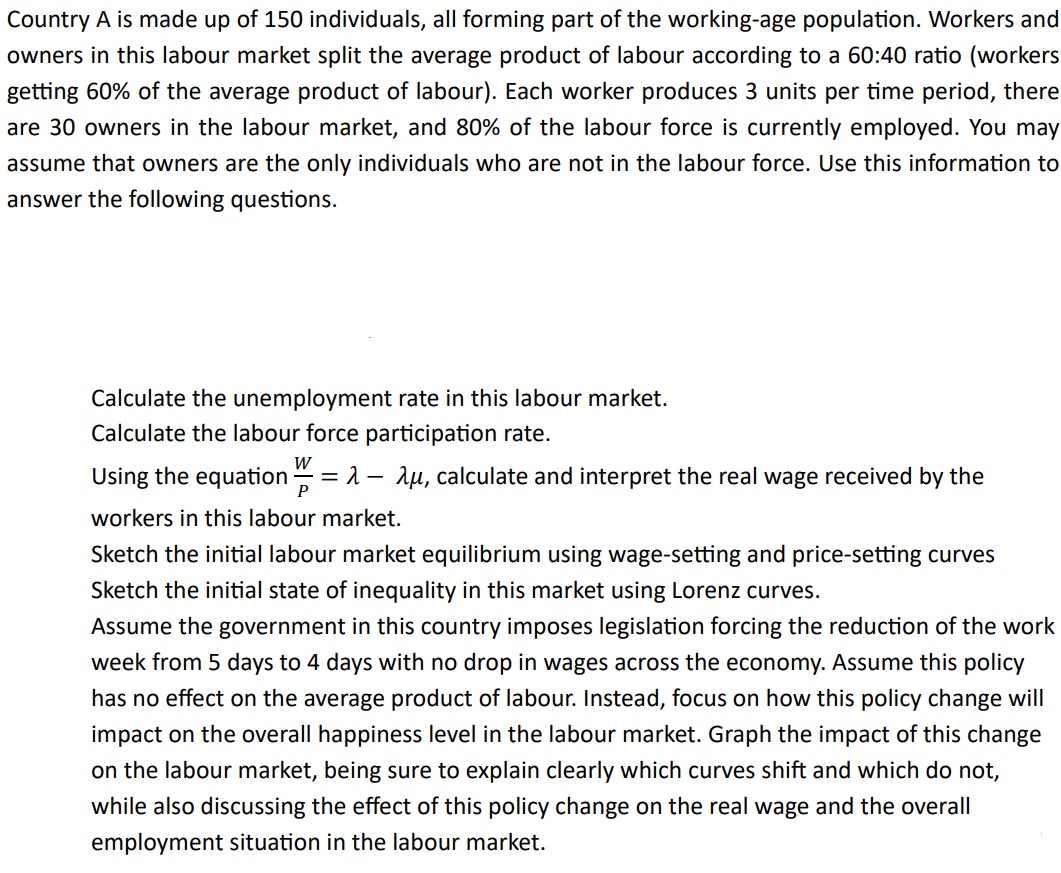

Transcribed Image Text:Country A is made up of 150 individuals, all forming part of the working-age population. Workers and
owners in this labour market split the average product of labour according to a 60:40 ratio (workers
getting 60% of the average product of labour). Each worker produces 3 units per time period, there
are 30 owners in the labour market, and 80% of the labour force is currently employed. You may
assume that owners are the only individuals who are not in the labour force. Use this information to
answer the following questions.
Calculate the unemployment rate in this labour market.
Calculate the labour force participation rate.
P
Using the equation =λ- λu, calculate and interpret the real wage received by the
workers in this labour market.
Sketch the initial labour market equilibrium using wage-setting and price-setting curves
Sketch the initial state of inequality in this market using Lorenz curves.
Assume the government in this country imposes legislation forcing the reduction of the work
week from 5 days to 4 days with no drop in wages across the economy. Assume this policy
has no effect on the average product of labour. Instead, focus on how this policy change will
impact on the overall happiness level in the labour market. Graph the impact of this change
on the labour market, being sure to explain clearly which curves shift and which do not,
while also discussing the effect of this policy change on the real wage and the overall
employment situation in the labour market.
Expert Solution
This question has been solved!
Explore an expertly crafted, step-by-step solution for a thorough understanding of key concepts.

Step by stepSolved in 4 steps

Knowledge Booster


Learn more about
Need a deep-dive on the concept behind this application? Look no further. Learn more about this topic, economics and related others by exploring similar questions and additional content below.Similar questions
- I need help with the first three sections please!arrow_forwardin c) Suggest solutions to the limitations of the Efficiency Wage Model.arrow_forwardMany government assistance programs phase-out as recipients' income increases. The government can reduce the poverty trap by having this phase-out happen Question 25 options: more slowly. more quickly. completely once the recipient earns any income at all. there is no connection between phase-out rate and the poverty trap.arrow_forward
- Explain what is meant by the gender pay gap, and what horizontal and vertical segregation are. Critically discuss the possible effects for all three (pay gap, and what horizontal and vertical segregation) for the productivity of the national economy.arrow_forwardThe American Community Survey (ACS) is an ongoing nationwide survey conducted by the United States Census Bureau. The ACS provides data on income levels classified by race, gender, educational attainment, employment status and housing characteristics, among other categories. This data is used by many organizations, both public and private, to allocate funds and assess the changing conditions in local communities. According to the ACS, poverty rates in the United States are HIGHER/LOWER for part-time workers than they are for full‑time workers. According to the ACS, poverty rates in the United States are HIGHER/LOWER for black individuals than they are for white individuals. Suppose that the least expensive plan with which a family of four can provide itself a nutritionally balanced meal plan in 1963 is $820 . Given this information, what is the poverty threshold in 1963 for a family of four? poverty threshold: $arrow_forwardWhat are some of the causes of the poverty trap? Over the years a person cannot breakeven. O People do not have access to assistance programs. In the long run, working provides little financial gain. O Welfare programs offer much incentives for people to go back to school or retrain.arrow_forward
- Vbnnnnbbarrow_forwardRefer to the following diagram, in which Waa/Ww is the ratio of the African American wage rate to the white wage rate. S. aa 1 D aa African American Labor The demand curve in the diagram eventually slopes downward because a. as the African American-white wage ratio falls, firms will raise their discrimination coefficients. b. as the African American-white wage ratio rises, more firms find it "too costly" to indulge their tastes for discrimination. C. as the African American-white wage ratio falls, more firms find it "too costly" to indulge their tastes for discrimination. d. as the African American-white wage ratio falls, firms will reduce their discrimination coefficients.arrow_forward2. 3 takes the wage rate as given and chooses how many hours of work to supply in the labor market. Suppose ry) Economic theory implies that an individual worker you have information at the individual level from a sample of 1000 married women. H₁ = Bo + B1 W₁ + B₂Si + ei, where H is hours or work supplied, W is the wage rate, S is the salary earned by the husband, i is the subscript for the individual woman. (-). Suppose the estimated coefficient for B₁ is negative. Is the negative sign an expected result? Can economic theory explain this sign? Clearly discuss by considering all the relevant effects.arrow_forward
- One theory of a contributor to poverty is that it plays an important role or function in our society and our economic system. Maintaining a pool of people who are poor means that workers are always available for less desirable and lower-paying but necessary jobs. True Falsearrow_forwardDoes a “rational” individual always reduce labour supply in response to a proportionalincome tax? Why or why not? Use the labour-leisure model to illustrate your response.arrow_forwardA Lorenz curve is a graphical representation of wealth distribution among a population. Conduct research to learn more about the Lorenz curve and answer the following questions. Draw a Lorenz curve and label the following components: Lorenz curve, income inequality line, total population and total income. Explain the shape of the curve in terms of income distribution, i.e. what happens to income inequality as you move along the Lorenz curve? Explain the concept of economic mobility as it relates to the Lorenz curve.arrow_forward
arrow_back_ios
SEE MORE QUESTIONS
arrow_forward_ios
Recommended textbooks for you
 Principles of Economics (12th Edition)EconomicsISBN:9780134078779Author:Karl E. Case, Ray C. Fair, Sharon E. OsterPublisher:PEARSON
 Engineering Economy (17th Edition)EconomicsISBN:9780134870069Author:William G. Sullivan, Elin M. Wicks, C. Patrick KoellingPublisher:PEARSON
 Principles of Economics (MindTap Course List)EconomicsISBN:9781305585126Author:N. Gregory MankiwPublisher:Cengage Learning
 Managerial Economics: A Problem Solving ApproachEconomicsISBN:9781337106665Author:Luke M. Froeb, Brian T. McCann, Michael R. Ward, Mike ShorPublisher:Cengage Learning
 Managerial Economics & Business Strategy (Mcgraw-...EconomicsISBN:9781259290619Author:Michael Baye, Jeff PrincePublisher:McGraw-Hill Education
Principles of Economics (12th Edition)
Economics
ISBN:9780134078779
Author:Karl E. Case, Ray C. Fair, Sharon E. Oster
Publisher:PEARSON
Engineering Economy (17th Edition)
Economics
ISBN:9780134870069
Author:William G. Sullivan, Elin M. Wicks, C. Patrick Koelling
Publisher:PEARSON
Principles of Economics (MindTap Course List)
Economics
ISBN:9781305585126
Author:N. Gregory Mankiw
Publisher:Cengage Learning
Managerial Economics: A Problem Solving Approach
Economics
ISBN:9781337106665
Author:Luke M. Froeb, Brian T. McCann, Michael R. Ward, Mike Shor
Publisher:Cengage Learning
Managerial Economics & Business Strategy (Mcgraw-...
Economics
ISBN:9781259290619
Author:Michael Baye, Jeff Prince
Publisher:McGraw-Hill Education