FINANCIAL ACCOUNTING
10th Edition
ISBN: 9781259964947
Author: Libby
Publisher: MCG
expand_more
expand_more
format_list_bulleted
Question

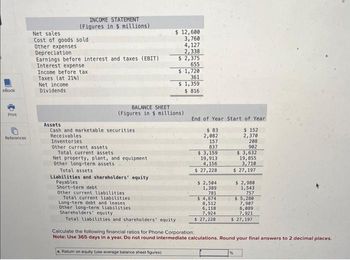
Transcribed Image Text:eBook
Print
References
INCOME STATEMENT
(Figures in 5 millions)
Net sales
Cost of goods sold
Other expenses
Depreciation
Earnings before interest and taxes (EBIT)
Interest expense
Income before tax
Taxes (at 21%)
Net income
Dividends
Assets
Cash and marketable securities
Receivables
Inventories
Other current assets
Total current assets.
BALANCE SHEET
(Figures in $ millions)
Net property, plant, and equipment
Other long-term assets
$ 12,600
3,760
4,127
2,338
$ 2,375
655
Total assets
Liabilities and shareholders' equity
Payables
Short-term debt
$1,720
361
$ 1,359
$816
Other current liabilities
Total current liabilities
Long-term debt and leases
Other long-term liabilities
Shareholders' equity
Total liabilities and shareholders' equity
End of Year Start of Year
$ 152
2,370
208
902
$ 3,632
19,855
3,710
$ 27,197
$83
2,082
157
837
$ 3,159
19,913
4,156
$ 27,228
$ 2,504
1,389
781
$ 4,674
8,512
6,118
7,924
$ 27,228
$ 2,980
1,543
757
$5,280
7,907
6,089
7,921
$ 27,197
Calculate the following financial ratios for Phone Corporation:
Note: Use 365 days in a year. Do not round intermediate calculations. Round your final answers to 2 decimal places.
a. Return on equity (use average balance sheet figures)
%

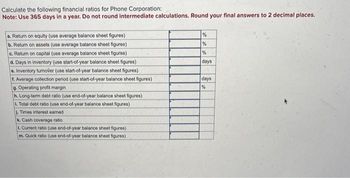
Transcribed Image Text:Calculate the following financial ratios for Phone Corporation:
Note: Use 365 days in a year. Do not round intermediate calculations. Round your final answers to 2 decimal places.
a. Return on equity (use average balance sheet figures)
b. Return on assets (use average balance sheet figures)
c. Return on capital (use average balance sheet figures)
d. Days in inventory (use start-of-year balance sheet figures)
e. Inventory tumover (use start-of-year balance sheet figures)
f. Average collection period (use start-of-year balance sheet figures)
9. Operating profit margin
h. Long-term debt ratio (use end-of-year balance sheet figures)
L. Total debt ratio (use end-of-year balance sheet figures)
J. Times interest earned
k. Cash coverage ratio
1. Current ratio (use end-of-year balance sheet figures)
m. Quick ratio (use end-of-year balance sheet figures)
%
%
%
days
days
%
Expert Solution
This question has been solved!
Explore an expertly crafted, step-by-step solution for a thorough understanding of key concepts.
This is a popular solution
Trending nowThis is a popular solution!
Step by stepSolved in 4 steps

Knowledge Booster
Learn more about
Need a deep-dive on the concept behind this application? Look no further. Learn more about this topic, accounting and related others by exploring similar questions and additional content below.Similar questions
- Required Prepare a vertical analysis of both the balance sheets and income statements for Year 4 and Year 3. Complete this question by entering your answers in the tabs below. Analysis Bal Analysis Inc Sheet Stmt Prepare a vertical analysis of the balance sheets for Year 4 and Year 3. (Percentages may not add exactly due to rounding. Round your answers to 2 decimal places. (i.e., .2345 should be entered as 23.45).) PEREZ COMPANY Vertical Analysis of Balance Sheets Year 4 Year 3 Percentage of Total Percentage of Total Amount Amount Assets Current assets Cash $ 17,400 % $ 12,600 % Marketable securities 21,000 7,600 Accounts receivable (net) 54,700 46,900 Inventories 136,200 144,400 Prepaid items 25,700 11,800 Total current assets 255,000 223,300 Investments 28,100 21,000 Plant (net) 270,500 255,100 Land 29,700 24,900 Total long-term assets 328,300 301,000 Total assets $ 583,300 $ 524,300 Liabilities and stockholders' equity Liabilities Current liabilities Notes payable $ 16,100 $ 5,000…arrow_forwardPrepare a horizontal analysis of both the balance sheet and income statement. Complete this question by entering your answers in the tabs below. Analysis Bal Analysis Inc Sheet Stmt Prepare a horizontal analysis of the income statement. (Negative answers should be indicated by a minus sign. Round your answers to 1 decimal place. (i.e., .234 should be entered as 23.4).) ALLENDALE COMPANY Horizontal Analysis of Income Statements Year 4 Year 3 % Change Revenues Sales (net) $ 230,000 $ 210,000 % Other revenues 8,000 5,000 Total revenues 238,000 215,000 Expenses Cost of goods sold 120,000 103,000 Selling, general, and administrative expenses 55,000 50,000 Interest expense 8,000 7,200 Income tax expense 23,000 22,000 Total expenses 206,000 182,200 Net income (loss) $ 32,000 $ 32,800 %arrow_forwardPlease help quick.arrow_forward
- Consider this simplified balance sheet for Geomorph Trading: Current assets Long-term assets $ 245 Current liabilities Long-term debt 630 Other liabilities Equity $ 875 Required: a. What is the company's debt-equity ratio? (Hint: debt = Current liabilities, Long-term debt, and Other liabilities) Note: Round your answer to 2 decimal places. b. What is the ratio of total long-term debt to total long-term capital? Note: Round your answer to 2 decimal places. c. What is its net working capital? d. What is its current ratio? Note: Round your answer to 2 decimal places. $ 170 215 140 350 $ 875 a Debt-equity ratio b. Long-term debt-to-capital ratio c. Net working capital d. Current ratioarrow_forwardComplete the balance sheet and sales information using the following financial data: Total assets turnover: 1.1x Days sales outstanding: 73.0 daysa Inventory turnover ratio: 4x Fixed assets turnover: 3.0x Current ratio: 2.5x Gross profit margin on sales: (Sales - Cost of goods sold)/Sales = 20% aCalculation is based on a 365-day year. Do not round intermediate calculations. Round your answers to the nearest dollar. Cash Accounts receivable Inventories Fixed assets Total assets Sales $ $ Balance Sheet $270,000 Current liabilities Long-term debt Common stock Retained earnings Total liabilities and equity Cost of goods sold $ $ $ 54,000 67,500arrow_forwardPlease answer both a and b thxarrow_forward
- 2) Ratios Based on the information given in picture #1, complete the following ratios for the last TWO years and indicate whether the trend is favorable or unfavorable. Note percentages and times should be to one decimal place (e.g. 14.8%; 5.8x) Profitability Ratios Current Yr. Prior Yr. Fav/Unfav. Gross Margin (%) {Gross Income/Sales Revenue} Profit Margin (%) {Net income/ Sales Revenue} Return on Assets (%) {Net Income/ Average Total Assets}arrow_forwardplease dont provide answer in image format thank youarrow_forwardFill in the Balance Sheet Fill in the Balance Sheet. (Do not round intermediate calculations. Round your answers to 2 decimal places.) Sales $6039 Total Assets Turnover 4.6 Current Ratio 3.6 Quick Ratio 3.4 Current Liabilities to Stockholders 0.5 Equity Average Collection Period (Use End of Year AR) Total Debt Ratio Cash Accounts Receivables Inventory Assets Total Current Asset Total Net Fixed Assets Total Assets 10 0.84 Balance Sheet Liabilities & Equity Accounts Payable Total Current Liabilities Long-Term Debt Total Liabilities Total Shareholders Equity Total Liabilities and Equityarrow_forward
- Required: 1. Complete the following columns for each item in the comparative financial statements (Negative answers shoul be indicated by a minus sign. Round percentage answers to 2 decimal places, i.e., 0.1243 should be entered as 12.43.): Increase (Decrease) Year 2 over Year 1 Amount Percentage Statement of earnings: Sales revenue Cost of sales Gross margin Operating expenses and interest expense Earnings before income taxes Income tax expense Net earnings $ 45,770 38,650 7,120 4,020 3,100 1,050 $ 2,050 Statement of financial position: Cash (4,720) Accounts receivable (net) (4,220) Inventory 6,200 Property, plant, and equipment (net) 6,380 $ 3,640 Current liabilities (3,840) Long-term debt 3,530 Common shares 0 Retained earnings 3,950 $ 3,640arrow_forwardPlease Solve In 15mins I will Thumbs-uparrow_forwardPrepare a vertical analysis of the balance sheets for Year 4 and Year 3. (Percentages may not add exactly due to rounding. Round your percentage answers to 2 decimal places. (i.e., 0.2345 should be entered as 23.45).) Assets Current assets Cash Marketable securities Accounts receivable (net) Inventories Prepaid items Total current assets Investments Plant (net) Land Total long-term assets Total assets Liabilities and stockholders' equity Lishilitinn WALTON COMPANY Vertical Analysis of Balance Sheets Year 4 $ Amount 17,800 21,300 55,100 136,900 25,700 256,800 27,600 270,600 30,300 328,500 585,300 Percentage of Total % $ $ Amount Year 3 13,700 6,800 47,500 144,700 10,500 223,200 21,100 256,000 24,900 302,000 525,200 Percentage of Total %arrow_forward
arrow_back_ios
SEE MORE QUESTIONS
arrow_forward_ios
Recommended textbooks for you

 AccountingAccountingISBN:9781337272094Author:WARREN, Carl S., Reeve, James M., Duchac, Jonathan E.Publisher:Cengage Learning,
 Accounting Information SystemsAccountingISBN:9781337619202Author:Hall, James A.Publisher:Cengage Learning,
 Horngren's Cost Accounting: A Managerial Emphasis...AccountingISBN:9780134475585Author:Srikant M. Datar, Madhav V. RajanPublisher:PEARSON
 Intermediate AccountingAccountingISBN:9781259722660Author:J. David Spiceland, Mark W. Nelson, Wayne M ThomasPublisher:McGraw-Hill Education
 Financial and Managerial AccountingAccountingISBN:9781259726705Author:John J Wild, Ken W. Shaw, Barbara Chiappetta Fundamental Accounting PrinciplesPublisher:McGraw-Hill Education


Accounting
Accounting
ISBN:9781337272094
Author:WARREN, Carl S., Reeve, James M., Duchac, Jonathan E.
Publisher:Cengage Learning,

Accounting Information Systems
Accounting
ISBN:9781337619202
Author:Hall, James A.
Publisher:Cengage Learning,

Horngren's Cost Accounting: A Managerial Emphasis...
Accounting
ISBN:9780134475585
Author:Srikant M. Datar, Madhav V. Rajan
Publisher:PEARSON

Intermediate Accounting
Accounting
ISBN:9781259722660
Author:J. David Spiceland, Mark W. Nelson, Wayne M Thomas
Publisher:McGraw-Hill Education

Financial and Managerial Accounting
Accounting
ISBN:9781259726705
Author:John J Wild, Ken W. Shaw, Barbara Chiappetta Fundamental Accounting Principles
Publisher:McGraw-Hill Education