(c) Notice that for =90% of the samples, the 95% confidence interval contains the population mean. Choose the 20 correct statement. When constructing 95% confidence intervals for 20 samples of the same size from the population, exactly 95% of the samples will contain the population mean. O When constructing 95% confidence intervals for 20 samples of the same size from the population, at most 95% of the samples will contain the population mean. When constructing 95% confidence intervals for 20 samples of the same size from the population, it is possible that more or fewer than 95% of the samples will contain the population mean. (d) Choose ALL that are true. If there were a Sample 21 of size n=24 taken from the same population as Sample 14, then the 95% confidence interval for Sample 21 would be narrower than the 95% confidence interval for Sample 14.
(c) Notice that for =90% of the samples, the 95% confidence interval contains the population mean. Choose the 20 correct statement. When constructing 95% confidence intervals for 20 samples of the same size from the population, exactly 95% of the samples will contain the population mean. O When constructing 95% confidence intervals for 20 samples of the same size from the population, at most 95% of the samples will contain the population mean. When constructing 95% confidence intervals for 20 samples of the same size from the population, it is possible that more or fewer than 95% of the samples will contain the population mean. (d) Choose ALL that are true. If there were a Sample 21 of size n=24 taken from the same population as Sample 14, then the 95% confidence interval for Sample 21 would be narrower than the 95% confidence interval for Sample 14.

Glencoe Algebra 1, Student Edition, 9780079039897, 0079039898, 2018
18th Edition
ISBN:9780079039897
Author:Carter
Publisher:Carter
Chapter10: Statistics
Section10.1: Measures Of Center
Problem 9PPS

Related questions
Question
Transcribed Image Text:18
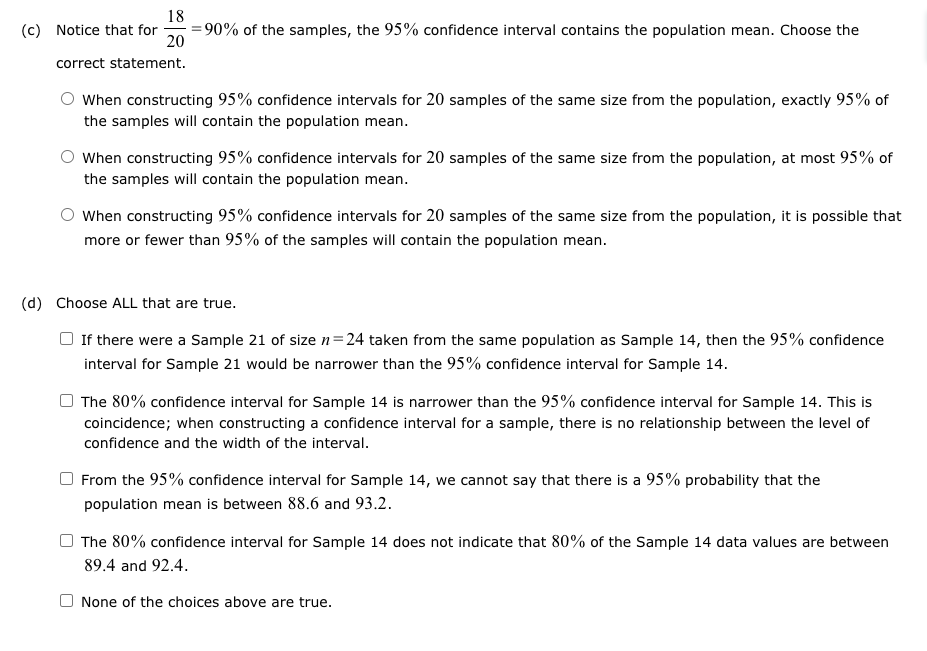
(c) Notice that for =90% of the samples, the 95% confidence interval contains the population mean. Choose the
20
correct statement.
When constructing 95% confidence intervals for 20 samples of the same size from the population, exactly 95% of
the samples will contain the population mean.
When constructing 95% confidence intervals for 20 samples of the same size from the population, at most 95% of
the samples will contain the population mean.
When constructing 95% confidence intervals for 20 samples of the same size from the population, it is possible that
more or fewer than 95% of the samples will contain the population mean.
(d) Choose ALL that are true.
If there were a Sample 21 of size n=24 taken from the same population as Sample 14, then the 95% confidence
interval for Sample 21 would be narrower than the 95% confidence interval for Sample 14.
The 80% confidence interval for Sample 14 is narrower than the 95% confidence interval for Sample 14. This is
coincidence; when constructing a confidence interval for a sample, there is no relationship between the level of
confidence and the width of the interval.
From the 95% confidence interval for Sample 14, we cannot say that there is a 95% probability that the
population mean is between 88.6 and 93.2.
The 80% confidence interval for Sample 14 does not indicate that 80% of the Sample 14 data values are between
89.4 and 92.4.
None of the choices above are true.
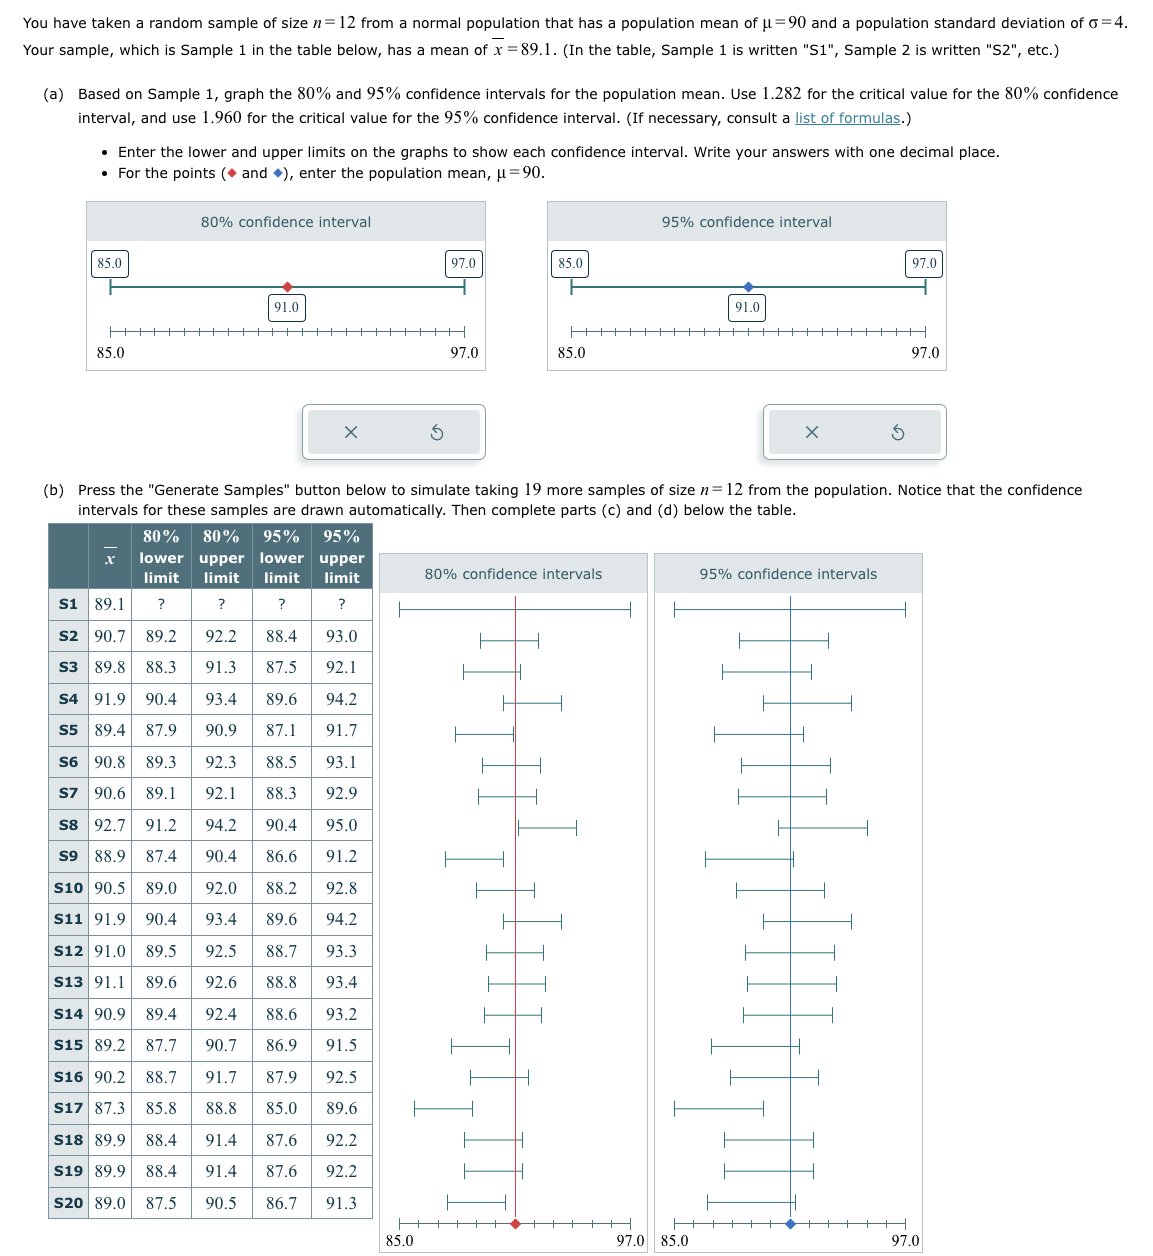
Transcribed Image Text:You have taken a random sample of size n = 12 from a normal population that has a population mean of μ = 90 and a population standard deviation of G = 4.
Your sample, which is Sample 1 in the table below, has a mean of x=89.1. (In the table, Sample 1 is written "S1", Sample 2 is written "S2", etc.)
(a) Based on Sample 1, graph the 80% and 95% confidence intervals for the population mean. Use 1.282 for the critical value for the 80% confidence
interval, and use 1.960 for the critical value for the 95% confidence interval. (If necessary, consult a list of formulas.)
• Enter the lower and upper limits on the graphs to show each confidence interval. Write your answers with one decimal place.
• For the points (and ◆), enter the population mean, μ = 90.
85.0
S1
|+H
85.0
80% confidence interval
91.0
X
+||||||||
x
80% 80% 95% 95%
lower upper lower upper
limit limit limit limit
?
89.1
?
?
?
S2 90.7
89.2
92.2 88.4
93.0
S3 89.8 88.3
91.3 87.5 92.1
S4 91.9 90.4
S5 89.4 87.9
S6 90.8 89.3
S7 90.6 89.1
S8 92.7 91.2
S9 88.9 87.4
93.4 89.6 94.2
90.9 87.1 91.7
92.3 88.5 93.1
92.1 88.3 92.9
94.2 90.4 95.0
90.4 86.6 91.2
92.0
S10 90.5 89.0
88.2 92.8
S11 91.9| 90.4
93.4
89.6 94.2
S12 91.0 89.5 92.5 88.7 93.3
S13 91.1 89.6 92.6
88.8
93.4
88.6 93.2
S14 90.9 89.4 92.4
|S15|89.2 87.7 90.7
86.9
91.5
91.7
87.9 92.5
S16 90.2 88.7
S17 87.3 85.8
88.8 85.0 89.6
S18 89.9
88.4
91.4 87.6 92.2
S19 89.9 88.4
91.4 87.6 92.2
S20 89.0 87.5 90.5 86.7 91.3
97.0
85.0
97.0
85.0
H
85.0
95% confidence interval
(b) Press the "Generate Samples" button below to simulate taking 19 more samples of size n = 12 from the population. Notice that the confidence
intervals for these samples are drawn automatically. Then complete parts (c) and (d) below the table.
80% confidence intervals
91.0
97.0 85.0
97.0
+++H
95% confidence intervals
97.0
97.0
Expert Solution
This question has been solved!
Explore an expertly crafted, step-by-step solution for a thorough understanding of key concepts.

This is a popular solution!

Trending now
This is a popular solution!

Step by step
Solved in 4 steps

Recommended textbooks for you
Glencoe Algebra 1, Student Edition, 9780079039897…
Algebra
ISBN:
9780079039897
Author:
Carter
Publisher:
McGraw Hill
Glencoe Algebra 1, Student Edition, 9780079039897…
Algebra
ISBN:
9780079039897
Author:
Carter
Publisher:
McGraw Hill