
MATLAB: An Introduction with Applications
6th Edition
ISBN: 9781119256830
Author: Amos Gilat
Publisher: John Wiley & Sons Inc
expand_more
expand_more
format_list_bulleted
Related questions
Question
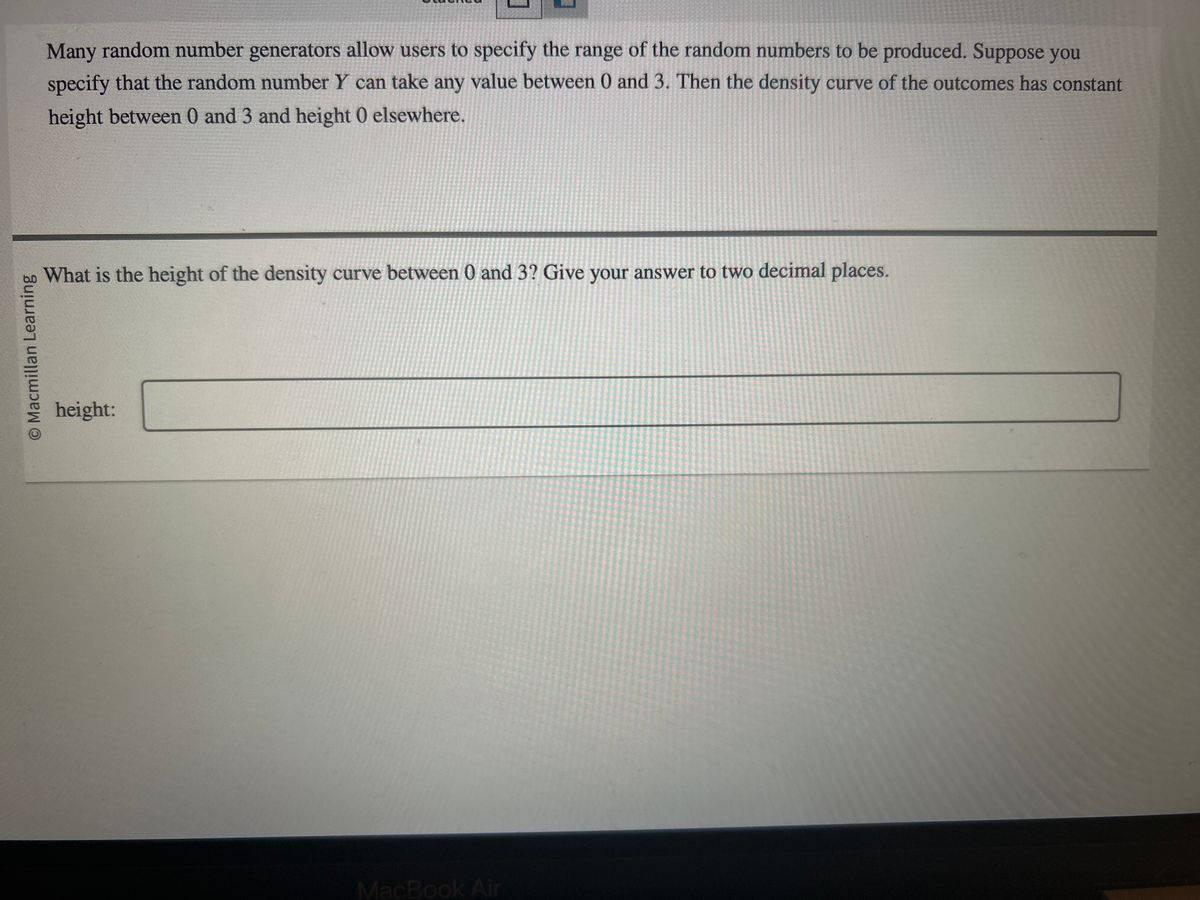

Transcribed Image Text:The text discusses the specification of a range for random number generators:
"Many random number generators allow users to specify the range of the random numbers to be produced. Suppose you specify that the random number \( Y \) can take any value between 0 and 3. Then the density curve of the outcomes has constant height between 0 and 3 and height 0 elsewhere."
A question follows:
"What is the height of the density curve between 0 and 3? Give your answer to two decimal places."
There is a text box labeled "height:" for inputting the answer.
The content is related to probability density functions, where the constant height over a specified interval implies a uniform distribution. The height is determined by ensuring the total area under the curve equals 1.
Expert Solution
arrow_forward
Step 1: Determine the given variables.
The question is about continuous probability distribution.
Introduction :
Let, Y be the random variable which follows uniform distribution then the probability density function is given by
%3C%2Fmo%3E%3Cmo%3E%26%23xA0%3B%3C%2Fmo%3E%3Cmo%3E%3D%3C%2Fmo%3E%3Cmo%3E%26%23xA0%3B%3C%2Fmo%3E%3Cmfrac%3E%3Cmn%3E1%3C%2Fmn%3E%3Cmrow%3E%3Cmi%3Eb%3C%2Fmi%3E%3Cmo%3E-%3C%2Fmo%3E%3Cmi%3Ea%3C%2Fmi%3E%3C%2Fmrow%3E%3C%2Fmfrac%3E%3Cmo%3E%26%23xA0%3B%3C%2Fmo%3E%3Cmo%3E%26%23xA0%3B%3C%2Fmo%3E%3Cmo%3E%3B%3C%2Fmo%3E%3Cmo%3E%26%23xA0%3B%3C%2Fmo%3E%3Cmi%3Ea%3C%2Fmi%3E%3Cmo%3E%26%23xA0%3B%3C%2Fmo%3E%3Cmo%3E%26%23x2264%3B%3C%2Fmo%3E%3Cmo%3E%26%23xA0%3B%3C%2Fmo%3E%3Cmi%3Ey%3C%2Fmi%3E%3Cmo%3E%26%23xA0%3B%3C%2Fmo%3E%3Cmo%3E%26%23x2264%3B%3C%2Fmo%3E%3Cmo%3E%26%23xA0%3B%3C%2Fmo%3E%3Cmi%3Eb%3C%2Fmi%3E%3C%2Fmath%3E--%3E%3Cdefs%3E%3Cstyle%20type%3D%22text%2Fcss%22%3E%40font-face%7Bfont-family%3A'a9ae65dcc5ba03ef2f0f633c7df668a'%3Bsrc%3Aurl(data%3Afont%2Ftruetype%3Bcharset%3Dutf-8%3Bbase64%2CAAEAAAAMAIAAAwBAT1MvMjv%2FLJYAAADMAAAATmNtYXDgWxEdAAABHAAAADxjdnQgAAAABwAAAVgAAAAEZ2x5ZoYrxVAAAAFcAAABW2hlYWQOdyayAAACuAAAADZoaGVhC0UVwQAAAvAAAAAkaG10eCg8AIUAAAMUAAAADGxvY2EAAAVKAAADIAAAABBtYXhwBIoEWwAAAzAAAAAgbmFtZXSF9ZsAAANQAAABrXBvc3QDogHPAAAFAAAAACBwcmVwukanGAAABSAAAAANAAAGtAGQAAUAAAgACAAAAAAACAAIAAAAAAAAAQIAAAAAAAAAAAAAAAAAAAAAAAAAAAAAAAAAAAAAACAgICAAAAAg8AMGe%2F57AAAHPgGyAAAAAAACAAEAAQAAABQAAwABAAAAFAAEACgAAAAGAAQAAQACAGEAZv%2F%2FAAAAYQBm%2F%2F%2F%2FoP%2BcAAEAAAAAAAAAAAAHAAIAVQAAAwADqwADAAcAADMRIRElIREhVQKr%2FasCAP4AA6v8VVUDAAADAC3%2FdAQDBFkACwAXAB0AOxgBsB0QsAPUsAMQsBTUsBQQsBzUsBwQsAnUsBwQsA48sAkQsBs8ALAGELAR1LAGELAA1LAAELAX1DAxASIAERYSMzISNxAmBhYDAgYjIiY1NDYzATUGEyMSAgGz%2Ft8W9bLTugOFhnAWDE6FWbKyhQHtjASyUQRZ%2Ft%2F%2B3vX%2B3wEz4wGnnLIt%2Fp3%2FAGXInN%2By%2FFmMXQHn%2FV4AAQAB%2FvUC9QZDABoANRgBsBsQsAjUsAgQsAHUsBsQsAzUsAwQsBjUALAbELAK1LAKELAL1LAbELAA1LAAELAY1DAxAREQIyInNRY3ESM3FzUQITIXFSYjIgYdASEVAWXfWSyxAYYDgwFkWYVZWVmFAQsDp%2FxZ%2FvUshlmyA6eHAYUBkVmGWVmyhYYAAAEAAAABAACav9usXw889QADCAD%2F%2F%2F%2F%2F1a3uPf%2F%2F%2F%2F%2FVre49AAH%2B9QQDBkMAAAAKAAIAAQAAAAAAAQAABz7%2BTgAAF3AAAf%2F8BAMAAQAAAAAAAAAAAAAAAAAAAAMDUgBVBEwALQLxAAEAAAAAAAAAKAAAANEAAAFbAAEAAAADAB4AAwAAAAAAAgCABAAAAAAABAAAOwAAAAAAAAAVAQIAAAAAAAAAAQAWAAAAAAAAAAAAAgAOABYAAAAAAAAAAwA0ACQAAAAAAAAABAAWAFgAAAAAAAAABQAWAG4AAAAAAAAABgALAIQAAAAAAAAACAAcAI8AAQAAAAAAAQAWAAAAAQAAAAAAAgAOABYAAQAAAAAAAwA0ACQAAQAAAAAABAAWAFgAAQAAAAAABQAWAG4AAQAAAAAABgALAIQAAQAAAAAACAAcAI8AAwABBAkAAQAWAAAAAwABBAkAAgAOABYAAwABBAkAAwA0ACQAAwABBAkABAAWAFgAAwABBAkABQAWAG4AAwABBAkABgALAIQAAwABBAkACAAcAI8ATQBhAHQAaAAgAEYAbwBuAHQAIAAyAFIAZQBnAHUAbABhAHIATQBhAHQAaABzACAARgBvAHIAIABNAG8AcgBlACAATQBhAHQAaAAgAEYAbwBuAHQAIAAyAE0AYQB0AGgAIABGAG8AbgB0ACAAMgBWAGUAcgBzAGkAbwBuACAAMQAuADBNYXRoX0ZvbnRfMgBNAGEAdABoAHMAIABGAG8AcgAgAE0AbwByAGUAAAAAAwAAAAAAAAOfAc8AAAAAAAAAAAAAAAAAAAAAAAAAALkHIgAAjYUYALIAAAAAAAA%3D)format('truetype')%3Bfont-weight%3Anormal%3Bfont-style%3Anormal%3B%7D%40font-face%7Bfont-family%3A'math1edc4444c64e5dc5cf6ace9f112'%3Bsrc%3Aurl(data%3Afont%2Ftruetype%3Bcharset%3Dutf-8%3Bbase64%2CAAEAAAAMAIAAAwBAT1MvMi7iBBMAAADMAAAATmNtYXDEvmKUAAABHAAAAExjdnQgDVUNBwAAAWgAAAA6Z2x5ZoPi2VsAAAGkAAABm2hlYWQQC2qxAAADQAAAADZoaGVhCGsXSAAAA3gAAAAkaG10eE2rRkcAAAOcAAAAFGxvY2EAHTwYAAADsAAAABhtYXhwBT0FPgAAA8gAAAAgbmFtZaBxlY4AAAPoAAABn3Bvc3QB9wD6AAAFiAAAACBwcmVwa1uragAABagAAAAUAAADSwGQAAUAAAQABAAAAAAABAAEAAAAAAAAAQEAAAAAAAAAAAAAAAAAAAAAAAAAAAAAAAAAAAAAACAgICAAAAAg1UADev96AAAD6ACWAAAAAAACAAEAAQAAABQAAwABAAAAFAAEADgAAAAKAAgAAgACADsAPSISImT%2F%2FwAAADsAPSISImT%2F%2F%2F%2FG%2F8Xd8d2gAAEAAAAAAAAAAAAAAAABVAMsAIABAABWACoCWAIeAQ4BLAIsAFoBgAKAAKAA1ACAAAAAAAAAACsAVQCAAKsA1QEAASsABwAAAAIAVQAAAwADqwADAAcAADMRIRElIREhVQKr%2FasCAP4AA6v8VVUDAAACAFX%2FZADVAgAACgAOAAAzNTMVFAYHJz4BNwMzNSNVgC8vGx4eAUSAgIB6PVEUKQ40MQGAgAACAIAA6wLVAhUAAwAHAGUYAbAIELAG1LAGELAF1LAIELAB1LABELAA1LAGELAHPLAFELAEPLABELACPLAAELADPACwCBCwBtSwBhCwB9SwBxCwAdSwARCwAtSwBhCwBTywBxCwBDywARCwADywAhCwAzwxMBMhNSEdASE1gAJV%2FasCVQHAVdVVVQABAIABVQLVAasAAwAwGAGwBBCxAAP2sAM8sQIH9bABPLEFA%2BYAsQAAExCxAAblsQABExCwATyxAwX1sAI8EyEVIYACVf2rAatWAAMAgP%2BrAoACqwADAAcACwAvGAEAsQkAP7EIBeSxAgX0sQEE9LEGBfSxAwTksQUE9LEEBfSxBwEQPLEABhA8MDETBwE1EzUBFwE1IRWBAQH%2FAf4AAQH%2F%2FgABq1b%2FAFYBqlb%2FAFb%2BVlVVAAABAAAAAQAA1XjOQV8PPPUAAwQA%2F%2F%2F%2F%2F9Y6E3P%2F%2F%2F%2F%2F1joTcwAA%2FyAEgAOrAAAACgACAAEAAAAAAAEAAAPo%2F2oAABdwAAD%2FtgSAAAEAAAAAAAAAAAAAAAAAAAAFA1IAVQEEAFUDVgCAA1YAgAMAAIAAAAAAAAAAKAAAAF4AAADoAAABMgAAAZsAAQAAAAUAXgAFAAAAAAACAIAEAAAAAAAEAADeAAAAAAAAABUBAgAAAAAAAAABABIAAAAAAAAAAAACAA4AEgAAAAAAAAADADAAIAAAAAAAAAAEABIAUAAAAAAAAAAFABYAYgAAAAAAAAAGAAkAeAAAAAAAAAAIABwAgQABAAAAAAABABIAAAABAAAAAAACAA4AEgABAAAAAAADADAAIAABAAAAAAAEABIAUAABAAAAAAAFABYAYgABAAAAAAAGAAkAeAABAAAAAAAIABwAgQADAAEECQABABIAAAADAAEECQACAA4AEgADAAEECQADADAAIAADAAEECQAEABIAUAADAAEECQAFABYAYgADAAEECQAGAAkAeAADAAEECQAIABwAgQBNAGEAdABoACAARgBvAG4AdABSAGUAZwB1AGwAYQByAE0AYQB0AGgAcwAgAEYAbwByACAATQBvAHIAZQAgAE0AYQB0AGgAIABGAG8AbgB0AE0AYQB0AGgAIABGAG8AbgB0AFYAZQByAHMAaQBvAG4AIAAxAC4AME1hdGhfRm9udABNAGEAdABoAHMAIABGAG8AcgAgAE0AbwByAGUAAAMAAAAAAAAB9AD6AAAAAAAAAAAAAAAAAAAAAAAAAAC5BxEAAI2FGACyAAAAFRQTsQABPw%3D%3D)format('truetype')%3Bfont-weight%3Anormal%3Bfont-style%3Anormal%3B%7D%40font-face%7Bfont-family%3A'round_brackets18549f92a457f2409'%3Bsrc%3Aurl(data%3Afont%2Ftruetype%3Bcharset%3Dutf-8%3Bbase64%2CAAEAAAAMAIAAAwBAT1MvMjwHLFQAAADMAAAATmNtYXDf7xCrAAABHAAAADxjdnQgBAkDLgAAAVgAAAASZ2x5ZmAOz2cAAAFsAAABJGhlYWQOKih8AAACkAAAADZoaGVhCvgVwgAAAsgAAAAkaG10eCA6AAIAAALsAAAADGxvY2EAAARLAAAC%2BAAAABBtYXhwBIgEWQAAAwgAAAAgbmFtZXHR30MAAAMoAAACOXBvc3QDogHPAAAFZAAAACBwcmVwupWEAAAABYQAAAAHAAAGcgGQAAUAAAgACAAAAAAACAAIAAAAAAAAAQIAAAAAAAAAAAAAAAAAAAAAAAAAAAAAAAAAAAAAACAgICAAAAAo8AMGe%2F57AAAHPgGyAAAAAAACAAEAAQAAABQAAwABAAAAFAAEACgAAAAGAAQAAQACACgAKf%2F%2FAAAAKAAp%2F%2F%2F%2F2f%2FZAAEAAAAAAAAAAAFUAFYBAAAsAKgDgAAyAAcAAAACAAAAKgDVA1UAAwAHAAA1MxEjEyMRM9XVq4CAKgMr%2FQAC1QABAAD%2B0AIgBtAACQBNGAGwChCwA9SwAxCwAtSwChCwBdSwBRCwANSwAxCwBzywAhCwCDwAsAoQsAPUsAMQsAfUsAoQsAXUsAoQsADUsAMQsAI8sAcQsAg8MTAREAEzABEQASMAAZCQ%2FnABkJD%2BcALQ%2FZD%2BcAGQAnACcAGQ%2FnAAAQAA%2FtACIAbQAAkATRgBsAoQsAPUsAMQsALUsAoQsAXUsAUQsADUsAMQsAc8sAIQsAg8ALAKELAD1LADELAH1LAKELAF1LAKELAA1LADELACPLAHELAIPDEwARABIwAREAEzAAIg%2FnCQAZD%2BcJABkALQ%2FZD%2BcAGQAnACcAGQ%2FnAAAQAAAAEAAPW2NYFfDzz1AAMIAP%2F%2F%2F%2F%2FVre7u%2F%2F%2F%2F%2F9Wt7u4AAP7QA7cG0AAAAAoAAgABAAAAAAABAAAHPv5OAAAXcAAA%2F%2F4DtwABAAAAAAAAAAAAAAAAAAAAAwDVAAACIAAAAiAAAAAAAAAAAAAkAAAAowAAASQAAQAAAAMACgACAAAAAAACAIAEAAAAAAAEAABNAAAAAAAAABUBAgAAAAAAAAABAD4AAAAAAAAAAAACAA4APgAAAAAAAAADAFwATAAAAAAAAAAEAD4AqAAAAAAAAAAFABYA5gAAAAAAAAAGAB8A%2FAAAAAAAAAAIABwBGwABAAAAAAABAD4AAAABAAAAAAACAA4APgABAAAAAAADAFwATAABAAAAAAAEAD4AqAABAAAAAAAFABYA5gABAAAAAAAGAB8A%2FAABAAAAAAAIABwBGwADAAEECQABAD4AAAADAAEECQACAA4APgADAAEECQADAFwATAADAAEECQAEAD4AqAADAAEECQAFABYA5gADAAEECQAGAB8A%2FAADAAEECQAIABwBGwBSAG8AdQBuAGQAIABiAHIAYQBjAGsAZQB0AHMAIAB3AGkAdABoACAAYQBzAGMAZQBuAHQAIAAxADgANQA0AFIAZQBnAHUAbABhAHIATQBhAHQAaABzACAARgBvAHIAIABNAG8AcgBlACAAUgBvAHUAbgBkACAAYgByAGEAYwBrAGUAdABzACAAdwBpAHQAaAAgAGEAcwBjAGUAbgB0ACAAMQA4ADUANABSAG8AdQBuAGQAIABiAHIAYQBjAGsAZQB0AHMAIAB3AGkAdABoACAAYQBzAGMAZQBuAHQAIAAxADgANQA0AFYAZQByAHMAaQBvAG4AIAAyAC4AMFJvdW5kX2JyYWNrZXRzX3dpdGhfYXNjZW50XzE4NTQATQBhAHQAaABzACAARgBvAHIAIABNAG8AcgBlAAAAAAMAAAAAAAADnwHPAAAAAAAAAAAAAAAAAAAAAAAAAAC5B%2F8AAY2FAA%3D%3D)format('truetype')%3Bfont-weight%3Anormal%3Bfont-style%3Anormal%3B%7D%3C%2Fstyle%3E%3C%2Fdefs%3E%3Ctext%20font-family%3D%22a9ae65dcc5ba03ef2f0f633c7df668a%22%20font-size%3D%2216%22%20font-style%3D%22italic%22%20text-anchor%3D%22middle%22%20x%3D%223.5%22%20y%3D%2226%22%3Ef%3C%2Ftext%3E%3Ctext%20font-family%3D%22round_brackets18549f92a457f2409%22%20font-size%3D%2216%22%20text-anchor%3D%22middle%22%20x%3D%2216.5%22%20y%3D%2226%22%3E(%3C%2Ftext%3E%3Ctext%20font-family%3D%22Arial%22%20font-size%3D%2216%22%20font-style%3D%22italic%22%20text-anchor%3D%22middle%22%20x%3D%2226.5%22%20y%3D%2226%22%3Ey%3C%2Ftext%3E%3Ctext%20font-family%3D%22round_brackets18549f92a457f2409%22%20font-size%3D%2216%22%20text-anchor%3D%22middle%22%20x%3D%2237.5%22%20y%3D%2226%22%3E)%3C%2Ftext%3E%3Ctext%20font-family%3D%22math1edc4444c64e5dc5cf6ace9f112%22%20font-size%3D%2216%22%20text-anchor%3D%22middle%22%20x%3D%2252.5%22%20y%3D%2226%22%3E%3D%3C%2Ftext%3E%3Cline%20stroke%3D%22%23000000%22%20stroke-linecap%3D%22square%22%20stroke-width%3D%221%22%20x1%3D%2267.5%22%20x2%3D%22105.5%22%20y1%3D%2220.5%22%20y2%3D%2220.5%22%2F%3E%3Ctext%20font-family%3D%22Arial%22%20font-size%3D%2216%22%20text-anchor%3D%22middle%22%20x%3D%2286.5%22%20y%3D%2215%22%3E1%3C%2Ftext%3E%3Ctext%20font-family%3D%22Arial%22%20font-size%3D%2216%22%20font-style%3D%22italic%22%20text-anchor%3D%22middle%22%20x%3D%2273.5%22%20y%3D%2238%22%3Eb%3C%2Ftext%3E%3Ctext%20font-family%3D%22math1edc4444c64e5dc5cf6ace9f112%22%20font-size%3D%2216%22%20text-anchor%3D%22middle%22%20x%3D%2286.5%22%20y%3D%2238%22%3E%26%23x2212%3B%3C%2Ftext%3E%3Ctext%20font-family%3D%22a9ae65dcc5ba03ef2f0f633c7df668a%22%20font-size%3D%2216%22%20font-style%3D%22italic%22%20text-anchor%3D%22middle%22%20x%3D%2298.5%22%20y%3D%2238%22%3Ea%3C%2Ftext%3E%3Ctext%20font-family%3D%22math1edc4444c64e5dc5cf6ace9f112%22%20font-size%3D%2216%22%20text-anchor%3D%22middle%22%20x%3D%22118.5%22%20y%3D%2226%22%3E%3B%3C%2Ftext%3E%3Ctext%20font-family%3D%22a9ae65dcc5ba03ef2f0f633c7df668a%22%20font-size%3D%2216%22%20font-style%3D%22italic%22%20text-anchor%3D%22middle%22%20x%3D%22129.5%22%20y%3D%2226%22%3Ea%3C%2Ftext%3E%3Ctext%20font-family%3D%22math1edc4444c64e5dc5cf6ace9f112%22%20font-size%3D%2216%22%20text-anchor%3D%22middle%22%20x%3D%22147.5%22%20y%3D%2226%22%3E%26%23x2264%3B%3C%2Ftext%3E%3Ctext%20font-family%3D%22Arial%22%20font-size%3D%2216%22%20font-style%3D%22italic%22%20text-anchor%3D%22middle%22%20x%3D%22163.5%22%20y%3D%2226%22%3Ey%3C%2Ftext%3E%3Ctext%20font-family%3D%22math1edc4444c64e5dc5cf6ace9f112%22%20font-size%3D%2216%22%20text-anchor%3D%22middle%22%20x%3D%22180.5%22%20y%3D%2226%22%3E%26%23x2264%3B%3C%2Ftext%3E%3Ctext%20font-family%3D%22Arial%22%20font-size%3D%2216%22%20font-style%3D%22italic%22%20text-anchor%3D%22middle%22%20x%3D%22196.5%22%20y%3D%2226%22%3Eb%3C%2Ftext%3E%3C%2Fsvg%3E)
Given :
Random no. Y take any value between 0 and 3.
To find :
Height of the density curve between 0 and 3.

Step by stepSolved in 3 steps with 3 images

Knowledge Booster

Similar questions
- Pa.90arrow_forwardAfter 120 rolls of the die the following data was produced. What test would you use to determine whether the die is fair or not. Face Value 1 2 3 4 5 6 Occurances 20 19 21 30 10 20 Name of Test _____________________________________________arrow_forwardThe data represent the results for a test for a certain disease. Assume one individual from the group is randomly selected. Find the probability of getting someone who tested positive, given that he or she had the disease. The probability is approximately The individual actually had the disease Yes D No 126 11 Positive Negative (Round to three decimal places as needed.) 34 129arrow_forward
- Use the data in the following table, which lists drive-thru order accuracy at popular fast food chains. Assume that orders are randomly selected from those included in the table. Drive-thru Restaurant D A Order Accurate Order Not Accurate 318 34 272 52 244 30 150 18 If one order is selected, find the probability of getting an order that is not accurate. The probability of getting an order that is not accurate is (Round to three decimal places as needed.)arrow_forwardUse the data in the following table, which lists drive-thru order accuracy at popular fast food chains. Assume that orders are randomly selected from those included in the table. Drive-thru Restaurant Q с A B D Order Accurate 318 271 244 134 Order Not Accurate 32 57 39 13 If one order is selected, find the probability of getting food that is not from Restaurant A. The probability of getting food that is not from Restaurant A is (Round to three decimal places as needed.)arrow_forward
arrow_back_ios
arrow_forward_ios
Recommended textbooks for you
- MATLAB: An Introduction with ApplicationsStatisticsISBN:9781119256830Author:Amos GilatPublisher:John Wiley & Sons Inc
 Probability and Statistics for Engineering and th...StatisticsISBN:9781305251809Author:Jay L. DevorePublisher:Cengage Learning
 Statistics for The Behavioral Sciences (MindTap C...StatisticsISBN:9781305504912Author:Frederick J Gravetter, Larry B. WallnauPublisher:Cengage Learning
  Elementary Statistics: Picturing the World (7th E...StatisticsISBN:9780134683416Author:Ron Larson, Betsy FarberPublisher:PEARSON
 The Basic Practice of StatisticsStatisticsISBN:9781319042578Author:David S. Moore, William I. Notz, Michael A. FlignerPublisher:W. H. Freeman
 Introduction to the Practice of StatisticsStatisticsISBN:9781319013387Author:David S. Moore, George P. McCabe, Bruce A. CraigPublisher:W. H. Freeman
MATLAB: An Introduction with Applications
Statistics
ISBN:9781119256830
Author:Amos Gilat
Publisher:John Wiley & Sons Inc
Probability and Statistics for Engineering and th...
Statistics
ISBN:9781305251809
Author:Jay L. Devore
Publisher:Cengage Learning
Statistics for The Behavioral Sciences (MindTap C...
Statistics
ISBN:9781305504912
Author:Frederick J Gravetter, Larry B. Wallnau
Publisher:Cengage Learning
Elementary Statistics: Picturing the World (7th E...
Statistics
ISBN:9780134683416
Author:Ron Larson, Betsy Farber
Publisher:PEARSON
The Basic Practice of Statistics
Statistics
ISBN:9781319042578
Author:David S. Moore, William I. Notz, Michael A. Fligner
Publisher:W. H. Freeman
Introduction to the Practice of Statistics
Statistics
ISBN:9781319013387
Author:David S. Moore, George P. McCabe, Bruce A. Craig
Publisher:W. H. Freeman