
MATLAB: An Introduction with Applications
6th Edition
ISBN: 9781119256830
Author: Amos Gilat
Publisher: John Wiley & Sons Inc
expand_more
expand_more
format_list_bulleted
Related questions
Question
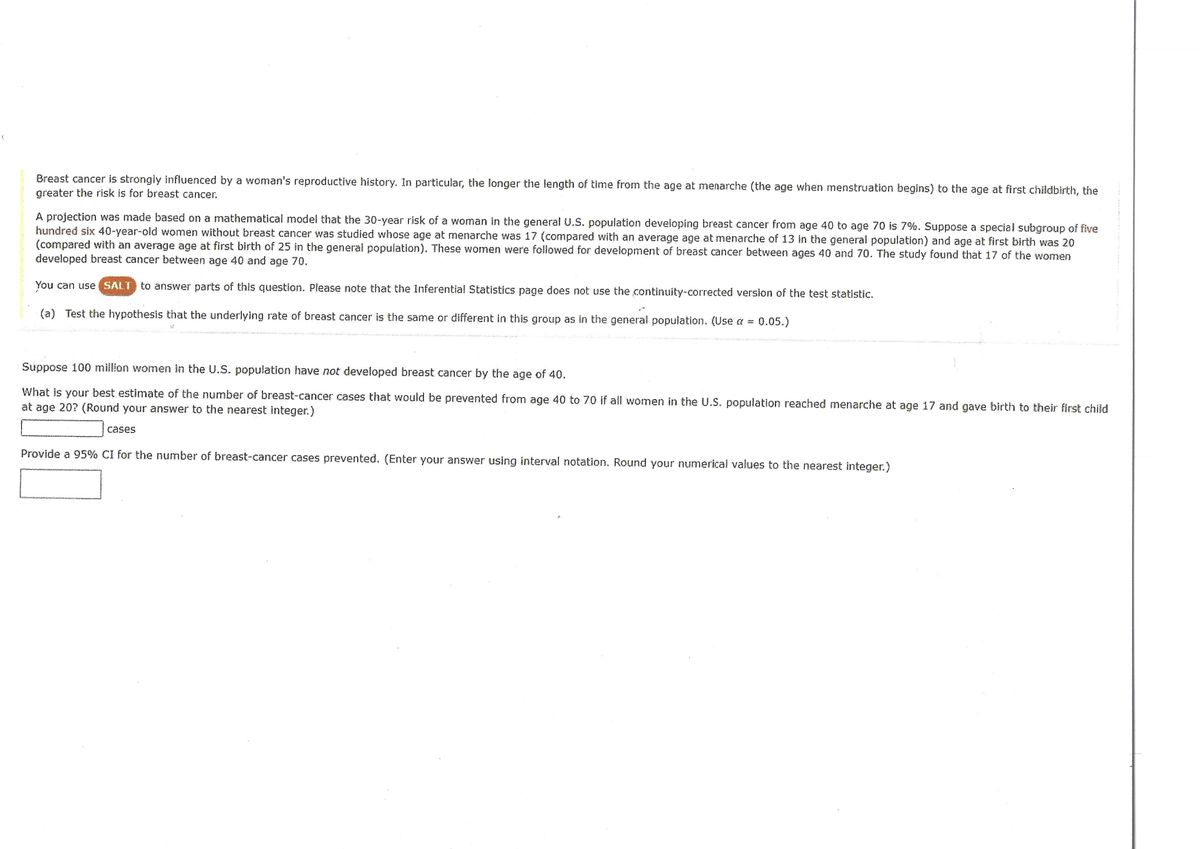

Transcribed Image Text:Breast cancer is strongly influenced by a woman's reproductive history. In particular, the longer the length of time from the age at menarche (the age when menstruation begins) to the age at first childbirth, the
greater the risk is for breast cancer.
A projection was made based on a mathematical model that the 30-year risk of a woman in the general U.S. population developing breast cancer from age 40 to age 70 is 7%. Suppose a special subgroup of five
hundred six 40-year-old women without breast cancer was studied whose age at menarche was 17 (compared with an average age at menarche of 13 in the general population) and age at first birth was 20
(compared with an average age at first birth of 25 in the general population). These women were followed for development of breast cancer between ages 40 and 70. The study found that 17 of the women
developed breast cancer between age 40 and age 70.
You can use SALT to answer parts of this question. Please note that the Inferential Statistics page does not use the continuity-corrected version of the test statistic.
(a) Test the hypothesis that the underlying rate of breast cancer is the same or different in this group as in the general population. (Use a = 0.05.)
Suppose 100 million women in the U.S. population have not developed breast cancer by the age of 40.
What is your best estimate of the number of breast-cancer cases that would be prevented from age 40 to 70 if all women in the U.S. population reached menarche at age 17 and gave birth to their first child
at age 20? (Round your answer to the nearest integer.)
cases
Provide a 95% CI for the number of breast-cancer cases prevented. (Enter your answer using interval notation. Round your numerical values to the nearest integer.)
Expert Solution
This question has been solved!
Explore an expertly crafted, step-by-step solution for a thorough understanding of key concepts.

This is a popular solution

Trending nowThis is a popular solution!

Step by stepSolved in 4 steps

Knowledge Booster

Similar questions
- 13) In a clinical study of an allergy drug, 115 of the 260 subjects reported experiencing significant relief from their symptoms. From the data, a 90% C.I. for the percentage of all subjects reported experiencing significant relief from their symptoms is (,blank ), blank (round to the 3rd decimal place).arrow_forwardSection 6.2 * 36e Coronary bypass surgy: Care Pesearch and Quality reported that 53% of people who had Coronary bypass Surgery in a recent were over the age of 65. ODR 15 The Agency for Health- year Coronary bypass patients are what is the mean number oE people over the age 65 in a Sample of 15 Coronary bypass patients? e y k d V. b C alt Varrow_forwardc and d pleasearrow_forward
- Express House Delivery Service provides high quality service to customers. The company guarantees a refund of all charges if a package it is delivering does not arrive at its destination by the specified time. It is known from past data that despite all efforts, 2% of the packages mailed through this company do not arrive at their destinations within the specified time. Suppose a corporation mails 10 packages through Express House Delivery Service on a certain day.arrow_forwardIs the national crime rate really going down? Some sociologists say yes! They say that the reason for the decline in crime rates in the 1980s and 1990s is demographics. It seems that the population is aging, and older people commit fewer crimes. According to the FBI and the Justice Department, 70% of all arrests are of males aged 15 to 34 years†. Suppose you are a sociologist in Rock Springs, Wyoming, and a random sample of police files showed that of 37 arrests last month, 22 were of males aged 15 to 34 years. Use a 10% level of significance to test the claim that the population proportion of such arrests in Rock Springs is different from 70%.arrow_forwardAge-related Macular Degeneration (AMD) is a common eye condition leading to vision loss. It causes damage to the macula, a small spot near the center of the retina (the part of the eye needed for sharp, central vision). Researchers are interested in the experiences of people who have been diagnosed with early-onset AMD. In particular the researchers are interested in whether the mean age at diagnosis of all people with early-onset AMD is less than 55 years. A random sample of 20 people with early-onset AMD gave the following data on age at diagnosis, in years. Patient 12 3 4 5 6 7 8 9 10 Age at diagnosis 50 58 52 58 49 58 51 61 54 59 Patient 11 12 13 14 15 16 17 18 19 20 Age at diagnosis 53 44 46 47 42 56 57 49 41 43 (d) State the conclusion of the test at the 5% level of significance. (e) Discuss why or why not an approximate normal test is appropriate here. (f) Perform an approximate normal test on the data at the 5% level. (g) Stating appropriate hypotheses perform the Student-t…arrow_forward
arrow_back_ios
arrow_forward_ios
Recommended textbooks for you
- MATLAB: An Introduction with ApplicationsStatisticsISBN:9781119256830Author:Amos GilatPublisher:John Wiley & Sons Inc
 Probability and Statistics for Engineering and th...StatisticsISBN:9781305251809Author:Jay L. DevorePublisher:Cengage Learning
 Statistics for The Behavioral Sciences (MindTap C...StatisticsISBN:9781305504912Author:Frederick J Gravetter, Larry B. WallnauPublisher:Cengage Learning
  Elementary Statistics: Picturing the World (7th E...StatisticsISBN:9780134683416Author:Ron Larson, Betsy FarberPublisher:PEARSON
 The Basic Practice of StatisticsStatisticsISBN:9781319042578Author:David S. Moore, William I. Notz, Michael A. FlignerPublisher:W. H. Freeman
 Introduction to the Practice of StatisticsStatisticsISBN:9781319013387Author:David S. Moore, George P. McCabe, Bruce A. CraigPublisher:W. H. Freeman
MATLAB: An Introduction with Applications
Statistics
ISBN:9781119256830
Author:Amos Gilat
Publisher:John Wiley & Sons Inc
Probability and Statistics for Engineering and th...
Statistics
ISBN:9781305251809
Author:Jay L. Devore
Publisher:Cengage Learning
Statistics for The Behavioral Sciences (MindTap C...
Statistics
ISBN:9781305504912
Author:Frederick J Gravetter, Larry B. Wallnau
Publisher:Cengage Learning
Elementary Statistics: Picturing the World (7th E...
Statistics
ISBN:9780134683416
Author:Ron Larson, Betsy Farber
Publisher:PEARSON
The Basic Practice of Statistics
Statistics
ISBN:9781319042578
Author:David S. Moore, William I. Notz, Michael A. Fligner
Publisher:W. H. Freeman
Introduction to the Practice of Statistics
Statistics
ISBN:9781319013387
Author:David S. Moore, George P. McCabe, Bruce A. Craig
Publisher:W. H. Freeman