
MATLAB: An Introduction with Applications
6th Edition
ISBN: 9781119256830
Author: Amos Gilat
Publisher: John Wiley & Sons Inc
expand_more
expand_more
format_list_bulleted
Related questions
Question
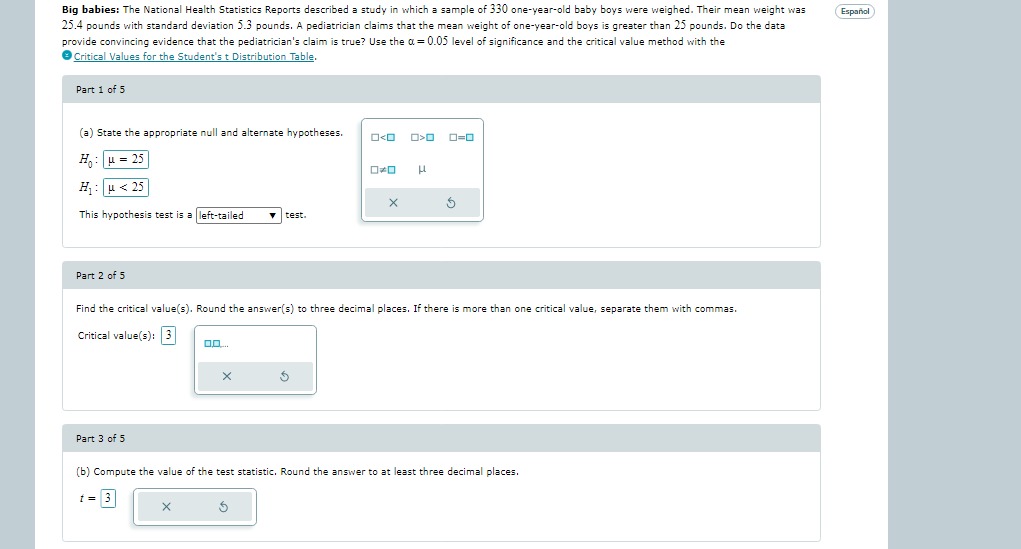

Transcribed Image Text:Big babies: The National Health Statistics Reports described a study in which a sample of 330 one-year-old baby boys were weighed. Their mean weight was
25.4 pounds with standard deviation 5.3 pounds. A pediatrician claims that the mean weight of one-year-old boys is greater than 25 pounds. Do the data
provide convincing evidence that the pediatrician's claim is true? Use the α = 0.05 level of significance and the critical value method with the
Critical Values for the Student's t Distribution Table
Part 1 of 5
(a) State the appropriate null and alternate hypotheses.
H₂ μ = 25
H₁ μ< 25
This hypothesis test is a left-tailed
Part 2 of 5
Part 3 of 5
0.0....
X
X
test.
Find the critical value(s). Round the answer(s) to three decimal places. f there is more than one critical value, separate them with commas.
Critical value(s): 3
S
O<O 0>0
5
0*0 H
X
0=0
5
(b) Compute the value of the test statistic. Round the answer to at least three decimal places.
t= 3
Español

Transcribed Image Text:Part 3 of 5
(b) Compute the value of the test statistic. Round the answer to at least three decimal places.
t = 3
Part 4 of 5
Reject
Determine whether to reject Ho
Part: 4/5
X
Part 5 of 5
S
the null hypothesis Ho.
(c) State a conclusion.
There is
pounds.
X
Ś
enough evidence to conclude that the mean weight of one-year-old boys is greater than 25
x
S
Expert Solution
This question has been solved!
Explore an expertly crafted, step-by-step solution for a thorough understanding of key concepts.

Step by stepSolved in 3 steps

Knowledge Booster

Similar questions
- In a test of the effectiveness of garlic for lowering cholesterol, 49 subjects were treated with raw garlic. Cholesterol levels were measured before and after the treatment. The changes (before minus after) in their levels of LDL cholesterol (in mg/dL) have a mean of 0.9 and a standard deviation of 2.33 . Use a 0.10 significance level to test the claim that with garlic treatment, the mean change in LDL cholesterol is greater than 0 . What do the results suggest about the effectiveness of the garlic treatment? Assume that a simple random sample has been selected. Identify the null and alternative hypotheses, test statistic, P-value, and state the final conclusion that addresses the original claim. What are the null and alternative hypotheses? A. Upper H 0 : mu greater than0 mg/dL Upper H 1 : mu less than0 mg/dL B. Upper H 0 : mu equals0 mg/dL Upper H 1 : mu less than0 mg/dL C. Upper H 0 : mu…arrow_forwardBone mineral density (BMD) is a measure of bone strength. Studies show that BMD declines after age 45. The impact of exercise may increase BMD. A random sample of 59 women between the ages of 41 and 45 with no major health problems were studied. The women were classified into one of two groups based upon their level of exercise activity: walking women and sedentary women. The 39 women who walked regularly had a mean BMD of 5.96 with a standard deviation of 1.22. The 20 women who are sedentary had a mean BMD of 4.41 with a standard deviation of 1.02. Which of the following inference procedures could be used to estimate the difference in the mean BMD for these two types of womenarrow_forwardBig babies: The National Health Statistics Reports described a study in which a sample of 96 one-year-old baby boys were weighed. Their mean weight was 25.6 pounds with standard deviation 5.3 pounds. A pediatrician claims that the mean weight of one-year-old boys is greater than 25 pounds. Do the data provide convincing evidence that the pediatrician's claim is true? Use the =α0.05 level of significance and the P -value method and Excel. Part: 0 / 5 0 of 5 Parts Complete Part 1 of 5 (a)State the appropriate null and alternate hypotheses. H0 : =μ25 H1 : >μ25 This hypothesis test is a ▼two-tailed test. Part: 1 / 5 1 of 5 Parts Complete Part 2 of 5 (b)Compute the value of the test statistic. Round the answer to at least three decimal places.…arrow_forward
- In a test of the effectiveness of garlic for lowering cholesterol, 49 subjects were treated with raw garlic. Cholesterol levels were measured before and after the treatment. The changes (before minus after) in their levels of LDL cholesterol (in mg/dL) have a mean of 0.8 and a standard deviation of 2.04. Use a 0.10 significance level to test the claim that with garlic treatment, the mean change in LDL cholesterol is greater than 0. What do the results suggest about the effectiveness of the garlic treatment? Assume that a simple random sample has been selected. Identify the null and alternative hypotheses, test statistic, P-value, and state the final conclusion that addresses the original claim.arrow_forwardIn a test of the effectiveness of garlic for lowering cholesterol, 49 subjects were treated with raw garlic. Cholesterol levels were measured before and after the treatment. The changes (before minus after) in their levels of LDL cholesterol (in mg/dL) have a mean of 0.3 and a standard deviation of 16.4. Use a 0.01 significance level to test the claim that with garlic treatment, the mean change in LDL cholesterol is greater than 0. What do the results suggest about the effectiveness of the garlic treatment? Assume that a simple random sample has been selected. Identify the null and alternative hypotheses, test statistic, P-value, and state the final conclusion that addresses the original claim.arrow_forwardIn a test of the effectiveness of garlic for lowering cholesterol, 49 subjects were treated with raw garlic. Cholesterol levels were measured before and after the treatment. The changes (before minus after) in their levels of LDL cholesterol (in mg/dL) have a mean of 0.6 and a standard deviation of 20.7. Use a 0.05 significance level to test the claim that with garlic treatment, the mean change in LDL cholesterol is greater than 0. What do the results suggest about the effectiveness of the garlic treatment? Assume that a simple random sample has been selected. Identify the null and alternative hypotheses, test statistic, P-value, and state the final conclusion that addresses the original claim. What are the null and alternative hypotheses? A. Ho: μ = 0 mg/dL H₁: μ> 0 mg/dL C. Ho: μ = 0 mg/dL H₁: μ#0 mg/dL Determine the test statistic. (Round to two decimal places as needed.) Determine the P-value. (Round to three decimal places as needed.) State the final conclusion that addresses the…arrow_forward
- Watching TV: In 2012, the General Social Survey asked a sample of 1318 people how much time they spent watching TV each day. The mean number of hours was 2.95 with a standard deviation of 2.63. A sociologist claims that people watch a mean of 3 hours of TV per day. Do the data provide sufficient evidence to conclude that the mean hours of TV watched per day differs from the claim? Use the a= 0.01 level of significance and the critical value method. Part: 0 / 5 Part 1 of 5 State the appropriate null and alternate hypotheses. H: H₁ : This hypothesis test is a (Choose one) test. 0<0 ☐☐ X □<口 μ 0=0 Śarrow_forwardIn a test of the effectiveness of garlic for lowering cholesterol, 50 subjects were treated with garlic in a processed tablet form. Cholesterol levels were measured before and after the treatment. The changes in their levels of LDL cholesterol (in mg/dL) have a mean of 3.2 and a standard deviation of 18.5. Complete parts (a) and (b) below. a) What is the best point estimate of the population mean net change in LDL cholesterol after the garlic treatment? b) Construct a 90% confidence interval estimate of the mean net change in LDL cholesterol after the garlic treatment. What does the confidence interval suggest about the effectiveness of garlic in reducing LDL cholesterol? What is the confidence interval estimate of the population mean μ?arrow_forwardIn a test of the effectiveness of garlic for lowering cholesterol, 81 subjects were treated with raw garlic. Cholesterol levels were measured before and after the treatment. The changes (before minus after) in their levels of LDL cholesterol (in mg/dL) have a mean of 0.2 and a standard deviation of 17.2. Use a 0.05 significance level to test the claim that with garlic treatment, the mean change in LDL cholesterol is greater than 0. What do the results suggest about the effectiveness of the garlic treatment? Assume that a simple random sample has been selected. Identify the null and alternative hypotheses, test statistic, P-value, and state the final conclusion that addresses the original claim. What are the null and alternative hypotheses? Ο Α. Hρ: μ=0 mg/dL O B. Ho: µ=0 mg/dL H;: u#0 mg/dL H,: µ>0 mg/dL O C . H: μ=0 mg/dL O D. Ho: µ>0 mg/dL H;: µ<0 mg/dL H,:µ<0 mg/dL Determine the test statistic. (Round to two decimal places as needed.) Determine the P-value, (Round to three decimal…arrow_forward
- In a test of the effectiveness of garlic for lowering cholesterol, 64 subjects were treated with raw garlic. Cholesterol levels were measured before and after the treatment. The changes (before minus after) in their levels of LDL cholesterol (in mg/dL) have a mean of 0.9 and a standard deviation of 16.9 . Use a 0.01 significance level to test the claim that with garlic treatment, the mean change in LDL cholesterol is greater than 0 . What do the results suggest about the effectiveness of the garlic treatment? Assume that a simple random sample has been selected. Identify the null and alternative hypotheses, test statistic, P-value, and state the final conclusion that addresses the original claim. What are the null and alternative hypotheses? A. Upper H 0 : mu equals0 mg/dL Upper H 1 : mu greater than0 mg/dL B. Upper H 0 : mu greater than0 mg/dL Upper H 1 : mu less than0 mg/dL C. Upper H 0 : mu…arrow_forwardBig babies: The National Health Statistics Reports described a study in which a sample of 335 one- year-old baby boys were weighed. Their mean weight was 25.2 pounds with standard deviation 5.3 pounds. A pediatrician claims that the mean weight of one-year-old boys differs from 25 pounds. Do the data provide convincing evidence that the pediatrician's claim is true? Use the a= 0.01 level of significance and the critical value method with the Critical Values for the Student's t Distribution Table. Part 1 of 5 (a) State the appropriate null and alternate hypotheses. H0 μ-25 H1: u#25 This hypothesis test is a two-tailed V test. Part 2 of 5 Find the critical value(s). Round the answer(s) to three decimal places. If there is more than one critical value, separate them with commas. Critical value(s): 2.576 , 2.576 Part: 2/5 Part 3 of 5 (b) Compute the value of the test statistic. Round the answer to at least three decimal places.arrow_forwardThe valve pressure was tested on 250 engines and the mean pressure was 5.9 lbs/square inch. Assume the variance is known to be 0.36. If the valve was designed to produce a mean pressure of 5.8 lbs/square inch, is there sufficient evidence at the 0.02 level that the valve performs about the specifications?arrow_forward
arrow_back_ios
arrow_forward_ios
Recommended textbooks for you
- MATLAB: An Introduction with ApplicationsStatisticsISBN:9781119256830Author:Amos GilatPublisher:John Wiley & Sons Inc
 Probability and Statistics for Engineering and th...StatisticsISBN:9781305251809Author:Jay L. DevorePublisher:Cengage Learning
 Statistics for The Behavioral Sciences (MindTap C...StatisticsISBN:9781305504912Author:Frederick J Gravetter, Larry B. WallnauPublisher:Cengage Learning
  Elementary Statistics: Picturing the World (7th E...StatisticsISBN:9780134683416Author:Ron Larson, Betsy FarberPublisher:PEARSON
 The Basic Practice of StatisticsStatisticsISBN:9781319042578Author:David S. Moore, William I. Notz, Michael A. FlignerPublisher:W. H. Freeman
 Introduction to the Practice of StatisticsStatisticsISBN:9781319013387Author:David S. Moore, George P. McCabe, Bruce A. CraigPublisher:W. H. Freeman
MATLAB: An Introduction with Applications
Statistics
ISBN:9781119256830
Author:Amos Gilat
Publisher:John Wiley & Sons Inc
Probability and Statistics for Engineering and th...
Statistics
ISBN:9781305251809
Author:Jay L. Devore
Publisher:Cengage Learning
Statistics for The Behavioral Sciences (MindTap C...
Statistics
ISBN:9781305504912
Author:Frederick J Gravetter, Larry B. Wallnau
Publisher:Cengage Learning
Elementary Statistics: Picturing the World (7th E...
Statistics
ISBN:9780134683416
Author:Ron Larson, Betsy Farber
Publisher:PEARSON
The Basic Practice of Statistics
Statistics
ISBN:9781319042578
Author:David S. Moore, William I. Notz, Michael A. Fligner
Publisher:W. H. Freeman
Introduction to the Practice of Statistics
Statistics
ISBN:9781319013387
Author:David S. Moore, George P. McCabe, Bruce A. Craig
Publisher:W. H. Freeman