
MATLAB: An Introduction with Applications
6th Edition
ISBN: 9781119256830
Author: Amos Gilat
Publisher: John Wiley & Sons Inc
expand_more
expand_more
format_list_bulleted
Related questions
Question
Between 1971 and 1975, as part of the National Health and Nutrition Examination Survey (NHANES), 7,381 persons ages 40–77 years were enrolled in a follow-up study. At the time of enrollment, each study participant was classified as having or not having diabetes. During 1982–1984, enrollees were documented either to have died or were still alive. The results are summarized as follows.
1. Of the men enrolled in the NHANES follow-up study, calculate the ratio of non-diabetic to diabetic men.
2. Calculate the proportion of men in the NHANES follow-up study who were diabetics.
3. Calculate the proportion of deaths among men.
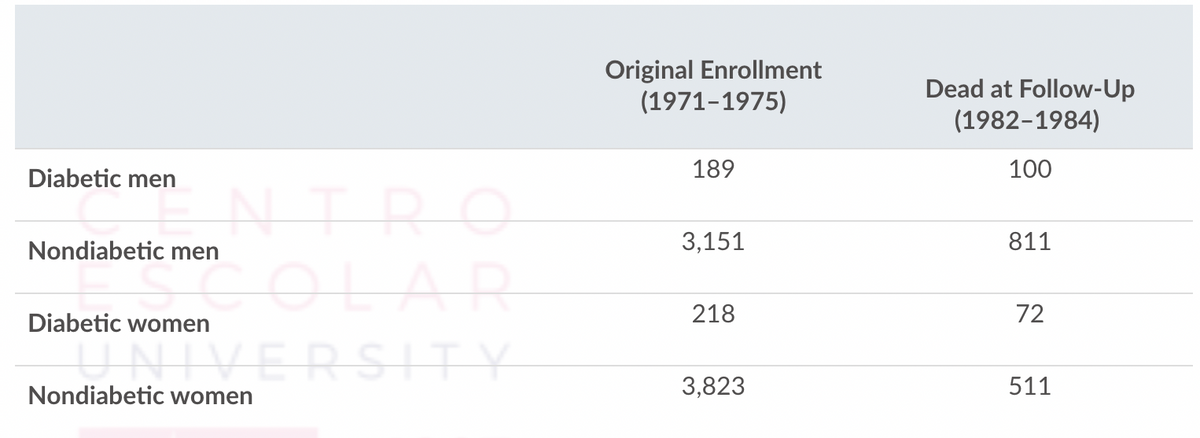

Transcribed Image Text:Diabetic men
NTRO
en OLAR
UNIVERSITY
Nondiabetic men
Diabetic women
Nondiabetic women
Original Enrollment
(1971-1975)
189
3,151
218
3,823
Dead at Follow-Up
(1982-1984)
100
811
72
511
Expert Solution
This question has been solved!
Explore an expertly crafted, step-by-step solution for a thorough understanding of key concepts.

This is a popular solution

Trending nowThis is a popular solution!

Step by stepSolved in 5 steps with 9 images

Knowledge Booster

Similar questions
- 1.arrow_forwardSince 1999, The Harris Poll has conducted an annual survey to measure the reputations of the most visible companies in the United States, as perceived by U.S. adults. The Harris Poll uses a sample of about 23,000 U.S. adults for the survey. The survey respondents rate companies according to 20 attributes that are classified into six categories: (1) social responsibility, (2)vision and leadership, (3)financial Performance ,(4)products and services, (5) emotional appeal, and (6) workplace environment. This information is used to determine the reputation of a company. Reputations of 10 Companies in the U.S. Company Name Year Company formed Reputation Industry Number of Employees Amazon.com 1994 Excellent Retail 230,800 Apple Inc 1977 Excellent Computer and peripherals 116,000 Netflix Inc 1999 Very good Internet Television 4,700 The Kraft Heinz Co 2015 Very good Food products 41,000 Facebook Inc 2004 good Internet…arrow_forwardAccording to the National Institute on Alcohol Abuse and Alcoholism (NIAAA), and the National Institutes of Health (NIH), 42% of college students nationwide engage in “binge drinking” behavior, having 5 or more drinks in one occasion during the past two weeks. A college president wonders if the proportion of students enrolled at her college that binge drink is actually different than the national proportion. In a commissioned study, 364 students are selected randomly from a list of all students enrolled at the college. Of these, 136 admitted to having engaged in binge drinking. The same college president is more interested in testing her suspicion that the proportion of students at her college that binge drink is different than the national proportion of .37. Use the statistic provided for her college above for your test. A. Define the null and alternative hypotheses to test this claim. B. By hand, calculate the test statistic for this test. C. Use…arrow_forward
- The National Assessment for Educational Progress measured the percentage of eighth grade students who were proficient in reading and the percentage of students who graduated from high school in each state in the U.S. The results for the ten most populous states are as follows: State Reading Proficiency Graduation Rate Califomia 60 75 Техas 73 74 New York 75 65 Florida 66 65 Illinois 75 79 Pennsylvania 79 83 Ohio 79 80 Michigan Georgia 73 73 67 62 North Carolina 71 73 Reading data from 2005, graduation data from 2007 Construct a scatterplot of graduation rate (y) versus reading proficiency (x). Which state is an outlier? b. Compute the least-squares line for predicting graduation rate from reading proficiency, using the data from all ten states. Remove the outlier and compute the least-squares line, using the data from the other nine states. C. d. Is the outlier an influential point? Explain.arrow_forwardIn 1961, the Child Health and Development Studies (CHDS) collected data on the births of over a thousand infants to determine a possible connection between infants' birthweights and parental smoking. The data provided are a subset of this data set, and they include each infant's birth weight in ounces. "BirthWeightounces" 112 87 116 91 105 115 97 145 120 124 117 102 113 118 108 122 138 128 133 125 116 128 101 134 128 126 135 113 132 126 137 124 126 112 132 143 110 137 131 110 110 92 132 85 131 75 131 136 122 139 75 147 119 128 120 104 114 105 116 103 143 110 124 127 108 122 134 128 84 130 97 86 129 110 124 116 125 113 117 117 119 115 144 99 78 135 124 128 101 111 125 104 174 115 105 114 119 110 69 102 121 134 106 123 109 127 145 117 118 129 85 138 121 130 176 130 116 133 139 122 75 116 121 130 119 103 101 144 106 129 134 121 126 115 120 127 86 114 124 124 94 119 142 137 131 96 112 132 113 117 135 110 79 136 99 104 128 142 96 143 108 102 115 130 125 126 104 135 139 143 128 132 110 117…arrow_forwardAccording to the National Institute on Alcohol Abuse and Alcoholism (NIAAA) and the National Institutes of Health (NIH), 41% of college students nationwide engage in "binge-drinking" behavior: having five or more drinks on one occasion during the past two weeks. A college president wonders if the proportion of students enrolled at her college who binge drink is actually lower than the national proportion. In a commissioned study, 346 students are selected randomly from a list of all students enrolled at the college. Of these, 135 admit to having engaged in binge drinking.The college president is more interested in testing her belief that the proportion of students at her college who engage in binge drinking is lower than the national proportion of 0.41. What is the P-value? (Round your answer to four decimal places.) P-value =arrow_forward
- A study prospectively examined whether sleep-disordered breathing was associated with an increased risk of death from any cause in a cohort of 600 adults participating in the Sleep Heart Health Study. Study participants were classified into four groups depending on the extent of their sleep-disordered breathing (none, mild, moderate, or severe). The counts of deaths over the course of the study are reported for each group in the following two-way table. Mild Severe 100 Death No Death Total None 40 100 140 40 100 140 Moderate 20 100 120 Total 200 400 600 100 200 We want to know whether the study findings give evidence of a significant difference of the number of deaths between the different groups. Set up the alternative hypothesis (H, : The distribution of the categorical variable is not as given by the null hypothesis (lack of fit) At least ones of the means is different from the others O The two categorical variables are dependent The distribution of the categorical variable is not…arrow_forwardA study prospectively examined whether sleep-disordered breathing was associated with an increased risk of death from any cause in a cohort of 600 adults participating in the Sleep Heart Health Study. Study participants were classified into four groups depending on the extent of their sleep-disordered breathing (none, mild, moderate, or severe). The counts of deaths over the course of the study are reported for each group in the following two-way table. Death No Death Total None 40 100 140 Mild 40 100 140 Moderate 20 100 120 Severe 100 100 200 Total 200 400 600 We want to know whether the study findings give evidence of a significant difference of the number of deaths between the different groups. The observed test statistic is 3.610 42.857 5.476 8.075arrow_forwardThe paper “State-Level Cancer Mortality Attributable to Cigarette Smoking in the United States’, (JAMA Internal Medicine [2016]: 1792-1798) included the following state estimates of the total number cancer deaths attributable to cigarette smoking in 2014. Number of State Number of People Number of State Number of People Alabama 3,183 Montana 581 Alaska 296 Nebraska 927 Arizona 3,246 Nevada 1,535 Arkansas 2,175 New Hampshire 723 California 14,689 New Jersey 4,388 Colorado 1,876 New Mexico 964 Connecticut 1,774 New York 9,296 Delaware 591 North Carolina 5,844 District of Columbia 310 North Dakota 341 Florida 12,596 Ohio 7,598 Georgia 4,816 Oklahoma 2,441 Hawaii 642 Oregon 2,143 Idaho 731 Pennsylvania 7,931 Illinois 7,114 Rhode Island 631 Indiana 4,099 South Carolina 2,962 Iowa 1,793 South Dakota 476 Kansas…arrow_forward
- 1. Carefully analyze Tables 2, 3, 4 & 5, and answer the following question. In this study, one exposed group is people who are in the 15-24 age group and had the recent stressor of mental illness. What is the unexposed group for this example? 2. In terms of suicide risk, which stressors affect the elderly (65+) more than other age groups?arrow_forwardAccording to the National Institute on Alcohol Abuse and Alcoholism (NIAAA), and the National Institutes of Health (NIH), 42% of college students nationwide engage in “binge drinking” behavior, having 5 or more drinks in one occasion during the past two weeks. A college president wonders if the proportion of students enrolled at her college that binge drink is actually different than the national proportion. In a commissioned study, 364 students are selected randomly from a list of all students enrolled at the college. Of these, 136 admitted to having engaged in binge drinking. Calculate the statistic for this sample. Calculate the standard error for this sample. Verify that we can use a normal distribution for this sample. By hand calculate a 90% confidence interval for the proportion of all students at this college that engage in binge drinking. Show all work. Interpret the results of your confidence interval in the context of the…arrow_forwardCompute the crude and standardized death rates in two cities from the following data and find out which population is healthier : Age City A City B Population Deaths Population Deaths Under 5 16,000 176 5,000 130 5-40 50,000 250 27,000 162 40-75 1,20,000 840 62,000 527 Above 75 14,000 910 6,000 420arrow_forward
arrow_back_ios
SEE MORE QUESTIONS
arrow_forward_ios
Recommended textbooks for you
- MATLAB: An Introduction with ApplicationsStatisticsISBN:9781119256830Author:Amos GilatPublisher:John Wiley & Sons Inc
 Probability and Statistics for Engineering and th...StatisticsISBN:9781305251809Author:Jay L. DevorePublisher:Cengage Learning
 Statistics for The Behavioral Sciences (MindTap C...StatisticsISBN:9781305504912Author:Frederick J Gravetter, Larry B. WallnauPublisher:Cengage Learning
  Elementary Statistics: Picturing the World (7th E...StatisticsISBN:9780134683416Author:Ron Larson, Betsy FarberPublisher:PEARSON
 The Basic Practice of StatisticsStatisticsISBN:9781319042578Author:David S. Moore, William I. Notz, Michael A. FlignerPublisher:W. H. Freeman
 Introduction to the Practice of StatisticsStatisticsISBN:9781319013387Author:David S. Moore, George P. McCabe, Bruce A. CraigPublisher:W. H. Freeman
MATLAB: An Introduction with Applications
Statistics
ISBN:9781119256830
Author:Amos Gilat
Publisher:John Wiley & Sons Inc
Probability and Statistics for Engineering and th...
Statistics
ISBN:9781305251809
Author:Jay L. Devore
Publisher:Cengage Learning
Statistics for The Behavioral Sciences (MindTap C...
Statistics
ISBN:9781305504912
Author:Frederick J Gravetter, Larry B. Wallnau
Publisher:Cengage Learning
Elementary Statistics: Picturing the World (7th E...
Statistics
ISBN:9780134683416
Author:Ron Larson, Betsy Farber
Publisher:PEARSON
The Basic Practice of Statistics
Statistics
ISBN:9781319042578
Author:David S. Moore, William I. Notz, Michael A. Fligner
Publisher:W. H. Freeman
Introduction to the Practice of Statistics
Statistics
ISBN:9781319013387
Author:David S. Moore, George P. McCabe, Bruce A. Craig
Publisher:W. H. Freeman