The normal distribution shown below was used to model the results of the PLANEA test for a certain year. The mean of the distribution is 76.5 and the standard deviation is 5.2 points. If you look at the figure, three values are missing from the x-axis. The middle value goes below the highest part of the curve, and the left and right values are the same distance (equidistant) from the value in the middle. Use the empirical rule to choose the value that best represents the percentage of the area under the curve that is highlighted. Also write the missing values. Percentage of total area shaded: (Choose one) v 600 65 70 75 I 80 85 90 95 Test score
The normal distribution shown below was used to model the results of the PLANEA test for a certain year. The mean of the distribution is 76.5 and the standard deviation is 5.2 points. If you look at the figure, three values are missing from the x-axis. The middle value goes below the highest part of the curve, and the left and right values are the same distance (equidistant) from the value in the middle. Use the empirical rule to choose the value that best represents the percentage of the area under the curve that is highlighted. Also write the missing values. Percentage of total area shaded: (Choose one) v 600 65 70 75 I 80 85 90 95 Test score
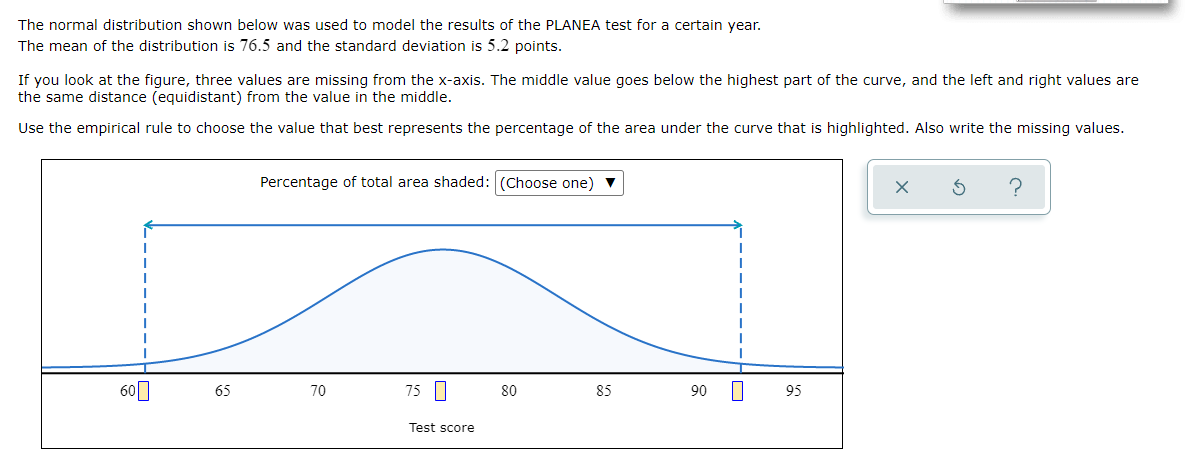
Transcribed Image Text:The normal distribution shown below was used to model the results of the PLANEA test for a certain year.
The mean of the distribution is 76.5 and the standard deviation is 5.2 points.
If you look at the figure, three values are missing from the x-axis. The middle value goes below the highest part of the curve, and the left and right values are
the same distance (equidistant) from the value in the middle.
Use the empirical rule to choose the value that best represents the percentage of the area under the curve that is highlighted. Also write the missing values.
Percentage of total area shaded: (Choose one) ▼
600
75 I
65
70
80
85
90
95
Test score
Expert Solution
This question has been solved!
Explore an expertly crafted, step-by-step solution for a thorough understanding of key concepts.