
MATLAB: An Introduction with Applications
6th Edition
ISBN: 9781119256830
Author: Amos Gilat
Publisher: John Wiley & Sons Inc
expand_more
expand_more
format_list_bulleted
Related questions
Question

Transcribed Image Text:6
5
4
3
2
1
0
0
www-ww
5
TITTI
10 15 20 25 30 35
40
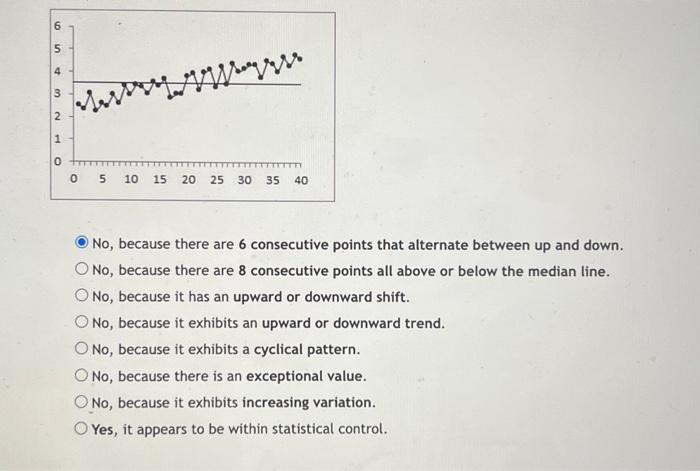
No, because there are 6 consecutive points that alternate between up and down.
O No, because there are 8 consecutive points all above or below the median line.
O No, because it has an upward or downward shift.
No, because it exhibits an upward or downward trend.
O No, because it exhibits a cyclical pattern.
O No, because there is an exceptional value.
No, because it exhibits increasing variation.
Yes, it appears to be within statistical control.

Transcribed Image Text:Below are two run charts for a process. For each one, answer the following question:
Based on the run chart, does the process appear to be statistically stable?
2.5
2
1.5
1
0.5
IMMAMU
0 tm
TTTTTTT)
05 10 15 20 25 30 35 40
O No, because there are 8 consecutive points all above or below the median line.
Yes, it appears to be within statistical control.
No, because there are 6 consecutive points that alternate between up and down.
No, because it exhibits increasing variation.
No, because there is an exceptional value.
No, because it exhibits an upward or downward trend.
O No, because it has an upward or downward shift.
O No, because it exhibits a cyclical pattern.
Expert Solution
This question has been solved!
Explore an expertly crafted, step-by-step solution for a thorough understanding of key concepts.

Step by stepSolved in 3 steps

Knowledge Booster

Similar questions
- An experiment was conducted to determine if exposure to an advertisement would change attitude toward a product. Each subject’s attitude before and after exposure to the advertisement was recorded, using a valid ten point scale. The results indicated: Subject Attitude Post Exposure Attitude Pre Exposure 1 6 4 2 8 5 3 6 6 4 4 3 5 7 2 6 6 3 7 9 6 8 7 6 9 8 5 10 8 6 Set up hypotheses and test to determine if the mean attitude toward the product increased as a result of exposure to the advertisement. (Note: these samples must be regarded as dependent, as each subject served as both a control (pre-exposure) and a treatment (post exposure). Fully interpret your result.arrow_forwardThe following data set is scaled scores from the SAT test in 2018: Student 1: 500 Student 2: 580 Student 3: 450 Student 4: 750 Student 5: 690 Student 6: 800 SAT scores are scaled from 200 to 800 points. How would you best classify this data? a. Cross-sectional Data b. Time Series Data c. Qualitative Data d. Longitudinal Data e. None of thesearrow_forwardThe increasing annual cost (including tuition, room, board, books and fees) to attend college) to attend college has been widely discussed in many public including Money magazine. The following random samples show the annual cost of attending private and public colleges. Data are in thousands of dollars. Click on the datafile logo to reference the data. Round degrees of freedom to the preceding whole number. DATA file Private Colleges 52.8 30.6 20.3 43.2 Public Colleges 45.8 22.8 22.0 25.8 45.0 33.3 37.8 50.5 28.2 15.6 18.5 44.0 25.6 42.0 a. Compute the sample mean and sample standard deviation for private and public colleges. Round your answers to two decimal places. F1 = 24.1 28.5 21.8 14.4 F2 = S₁ = S₂ b. What is the point estimate of the difference between the two population means? Round your answer to one decimal place. Interpret this value in terms of the annual cost of attending private and public colleges. $ c. Develop a 95% confidence interval of the difference between the…arrow_forward
- The following are the GPAs of 18 r/s SCC students:1.3, 1.5, 1.7, 2.2, 2.5, 2.6, 2.6, 2.6, 2.6, 2.8, 2.9, 2.9, 3.0, 3.1, 3.5, 3.5, 3.6, 3.9(a) Find the 70th percentile of the data.(b) Find the median and Q1and Q3Make sure you properly justify how to find them.(c)Find all outliers using the IQR method d) Draw the box plot of this dataarrow_forwardThe following table summarizes the grade point averages (GPAs) of graduatestudents in a statistics class. Approximate the mean GPA of the class.arrow_forwardWhat percent of the data fall between the 1st and 2rd quartiles? 1. 0% 2. 25% 3. 50% 4. 75% 5. 100%arrow_forward
- A researcher has collected the following sample data. The mean of the sample is 5. 3 5 12 3 2 The 75th percentile is 5 8.5 9 10arrow_forwardQ1]. [30%] The data for this question given in the table below come from the sample data folder of MINITAB. The data give you the monthly number of people employed (in units of 1000) in the retail trade industry in the state of Wisconsin from January 1970 to December 1974. Copy this timeseries data into an excel spreadsheet in your home area first before you start your analysis. You can use Excel to answer this question. Month 1970 1971 1972 1973 1974 1 322 322 330 348 361 2 317 318 326 345 354 3 319 320 329 349 357 4 323 326 337 355 367 5 327 332 345 362 376 6 328 334 350 367 381 7 325 335 351 366 381 8 326 336 354 370 383 9 330 335 355 371 384 10 334 338 357 375 387 11 337 342 362 380 392 12 341 348 368 385 396 (a) (b) (c) (d) Draw a time series plot of the data and comment on any noticeable patterns. Describe an appropriate time series model for this data, giving your reasons, and obtain estimates of the components of your model using the decomposition method. Using your model…arrow_forward
arrow_back_ios
arrow_forward_ios
Recommended textbooks for you
- MATLAB: An Introduction with ApplicationsStatisticsISBN:9781119256830Author:Amos GilatPublisher:John Wiley & Sons Inc
 Probability and Statistics for Engineering and th...StatisticsISBN:9781305251809Author:Jay L. DevorePublisher:Cengage Learning
 Statistics for The Behavioral Sciences (MindTap C...StatisticsISBN:9781305504912Author:Frederick J Gravetter, Larry B. WallnauPublisher:Cengage Learning
  Elementary Statistics: Picturing the World (7th E...StatisticsISBN:9780134683416Author:Ron Larson, Betsy FarberPublisher:PEARSON
 The Basic Practice of StatisticsStatisticsISBN:9781319042578Author:David S. Moore, William I. Notz, Michael A. FlignerPublisher:W. H. Freeman
 Introduction to the Practice of StatisticsStatisticsISBN:9781319013387Author:David S. Moore, George P. McCabe, Bruce A. CraigPublisher:W. H. Freeman
MATLAB: An Introduction with Applications
Statistics
ISBN:9781119256830
Author:Amos Gilat
Publisher:John Wiley & Sons Inc
Probability and Statistics for Engineering and th...
Statistics
ISBN:9781305251809
Author:Jay L. Devore
Publisher:Cengage Learning
Statistics for The Behavioral Sciences (MindTap C...
Statistics
ISBN:9781305504912
Author:Frederick J Gravetter, Larry B. Wallnau
Publisher:Cengage Learning
Elementary Statistics: Picturing the World (7th E...
Statistics
ISBN:9780134683416
Author:Ron Larson, Betsy Farber
Publisher:PEARSON
The Basic Practice of Statistics
Statistics
ISBN:9781319042578
Author:David S. Moore, William I. Notz, Michael A. Fligner
Publisher:W. H. Freeman
Introduction to the Practice of Statistics
Statistics
ISBN:9781319013387
Author:David S. Moore, George P. McCabe, Bruce A. Craig
Publisher:W. H. Freeman