
MATLAB: An Introduction with Applications
6th Edition
ISBN: 9781119256830
Author: Amos Gilat
Publisher: John Wiley & Sons Inc
expand_more
expand_more
format_list_bulleted
Related questions
Concept explainers
Topic Video
Question
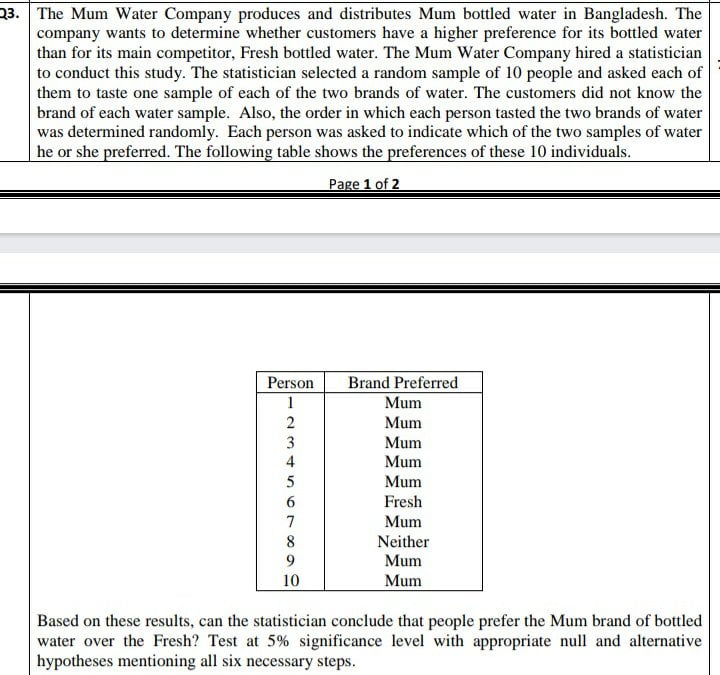

Transcribed Image Text:23. The Mum Water Company produces and distributes Mum bottled water in Bangladesh. The
company wants to determine whether customers have a higher preference for its bottled water
than for its main competitor, Fresh bottled water. The Mum Water Company hired a statistician
to conduct this study. The statistician selected a random sample of 10 people and asked each of
them to taste one sample of each of the two brands of water. The customers did not know the
brand of each water sample. Also, the order in which each person tasted the two brands of water
was determined randomly. Each person was asked to indicate which of the two samples of water
he or she preferred. The following table shows the preferences of these 10 individuals.
Page 1 of 2
Person
Brand Preferred
1
Mum
2
Mum
Mum
4
Mum
5
Mum
Fresh
7
Mum
Neither
9.
Mum
10
Mum
Based on these results, can the statistician conclude that people prefer the Mum brand of bottled
water over the Fresh? Test at 5% significance level with appropriate null and alternative
hypotheses mentioning all six necessary steps.
Expert Solution
This question has been solved!
Explore an expertly crafted, step-by-step solution for a thorough understanding of key concepts.

Step by stepSolved in 7 steps with 1 images

Knowledge Booster


Learn more about
Need a deep-dive on the concept behind this application? Look no further. Learn more about this topic, statistics and related others by exploring similar questions and additional content below.Similar questions
- Suppose 218 subjects are treated with a drug that is used to treat pain and 54 of them developed nausea. Use a 0.10 significance level to test the claim that more than 20% of users develop nausea. identify the null and alternative hypotheses for this test test statistic pvalue conclusionarrow_forwardAn airline company is interested in improving customer satisfaction rate from the 68% currently claimed. The company sponsored a survey of 129 customers and found that 97 customers were satisfied. What is the test statistic �? What is the �-value? Does sufficient evidence exist that the customer satisfaction rate is higher than the claim by the company at a significance level of �=0.05?arrow_forwardIn one study of smokers who tried to quit smoking with nicotine patch therapy, 36 were smoking one year after treatment and 34 were not smoking one year after the treatment. Use a 0.10 significance level to test the claim that among smokers who try to quit with nicotine patch therapy, the majority are smoking one year after the treatment. Do these results suggest that the nicotine patch therapy is not effective? Identify the null and alternative hypotheses for this test. Choose the correct answer below. O A. Ho: p=0.5 H, p>0.5 O B. Ho p= 0.5 H, p0.5 Ho: p>0.5 H, p=0.5arrow_forward
- A survey of 61,646 people included several questions about office relationships. Of the respondents, 26.2% reported that bosses scream at employees. Use a 0.01 significance level to test the claim that more than 1/4 of people say that bosses scream at employees. How is the conclusion affected after learning that the survey is an online survey in which Internet users chose whether to respond? ldentify the null hypothesis, alternative hypothesis, test statistic, P-value, conclusion about the null hvnothesis, and final conclusion that addresses the original claim, Use the P-value method. Use the normal distribution as an annroximation of the binomial distribution. Hip>0.75 H;: p 0.75 The test statistic is z= (Round to two decimal places as needed.)arrow_forwardA random sample of 859 births included 435 boys. Use a 0.01 significance level to test the claim that 51.3% of newborn babies are boys. Do the results support the belief that 51.3% of newborn babies are boys? test statistic_____ pvalue_____arrow_forwardConsider a drug that is used to help prevent blood clots in certain patients. In clinical trials, among 5897 patients treated with this drug, 165 developed the adverse reaction of nausea. Use a 0.10 significance level to test the claim that 3% of users developed nausea. Does nausea appear to be problematic adverse reaction? Identify the null and alternative hypotheses, test statistics, P-value and state the final conclusion that addresses the original claim.arrow_forward
- In a recent court case it was found that during a period of 11 years 852 people were selected for grand jury duty and 36% of them were from the same ethnicity. Among the people eligible for grand juryduty, 78.9% were of this ethnicity. Use a 0.05 significance level to test the claim that the selection process is biased against allowing this ethnicity to sit on the grand jury. Identify the null hypothesis, alternative hypothesis, test statistic, P-value, conclusion about the null hypothesis, and final conclusion that addresses the original claim. Use the P-value method and the normal distribution as an approximation to the binomial distribution.arrow_forwardIn a recent court case it was found that during a period of 11 years 868 people were selected for grand jury duty and 42% of them were from the same ethnicity. Among the people eligible for grand jury duty, 80.8% were of this ethnicity. Use a 0.05 significance level to test the claim that the selection process is biased against allowing this ethnicity to sit on the grand jury. Identify the null hypothesis, alternative hypothesis, test statistic, P-value, conclusion about the null hypothesis, and final conclusion that addresses the original claim. Use the P-value method and the normal distribution as an approximation to the binomial distribution. Which of the following is the hypothesis test to be conducted? What is the test statistic? What is the P-value? What is the conclusion on the null hypothesis? Does the jury selection system appear to be fair?arrow_forwardIn a study of the accuracy of fast food drive-through orders, one restaurant had 36 orders that were not accurate among 338 orders observed. Use a 0.01 significance level to test the claim that the rate of inaccurate orders is equal to 10%. Does the accuracy rate appear to be acceptable? The test statistic for this hypothesis test is The P-value for this hypothesis test isarrow_forward
- An airline company is interested in improving customer satisfaction rate from the 57% currently claimed. The company sponsored a survey of 244 customers and found that 154 customers were satisfied. Determine whether sufficient evidence exists that the customer satisfaction rate is higher than the claim by the company. What is the test statistic z? What is the p-value? Does sufficient evidence exist that the customer satisfaction rate is different than the claim by the company at a significance level of �=0.1?arrow_forwardIn a recent court case it was found that during a period of 11 years 883 people were selected for grand jury duty and 43% of them were from the same ethnicity. Among the people eligible for grand jury duty, 79.4% were of this ethnicity. Use a 0.01 significance level to test the claim that the selection process is biased against allowing this ethnicity to sit on the grand jury. Identify the null hypothesis, alternative hypothesis, test statistic, P-value, conclusion about the null hypothesis, and final conclusion that addresses the original claim. Use the P-value method and the normal distribution as an approximation to the binomial distribution. What is the hypothesis test to be conducted?arrow_forwardIn a recent court case it was found that during a period of 11 years 870 people were selected for grand jury duty and 37% of them were from the same ethnicity. Among the people eligible for grand jury duty, 79.6% were of this ethnicity. Use a 0.05 significance level to test the claim that the selection process is biased against allowing this ethnicity to sit on the grand jury. Identify the null hypothesis, alternative hypothesis, test statistic, P-value, conclusion about the null hypothesis, and final conclusion that addresses the original claim. Use the P-value method and the normal distribution as an approximation to the binomial distribution. a. What is the test statistic? z equals (Round to two decimal places as needed.) b. What is the P-value? P-value equals (Round to four decimal places as needed.)arrow_forward
arrow_back_ios
arrow_forward_ios
Recommended textbooks for you
- MATLAB: An Introduction with ApplicationsStatisticsISBN:9781119256830Author:Amos GilatPublisher:John Wiley & Sons Inc
 Probability and Statistics for Engineering and th...StatisticsISBN:9781305251809Author:Jay L. DevorePublisher:Cengage Learning
 Statistics for The Behavioral Sciences (MindTap C...StatisticsISBN:9781305504912Author:Frederick J Gravetter, Larry B. WallnauPublisher:Cengage Learning
  Elementary Statistics: Picturing the World (7th E...StatisticsISBN:9780134683416Author:Ron Larson, Betsy FarberPublisher:PEARSON
 The Basic Practice of StatisticsStatisticsISBN:9781319042578Author:David S. Moore, William I. Notz, Michael A. FlignerPublisher:W. H. Freeman
 Introduction to the Practice of StatisticsStatisticsISBN:9781319013387Author:David S. Moore, George P. McCabe, Bruce A. CraigPublisher:W. H. Freeman
MATLAB: An Introduction with Applications
Statistics
ISBN:9781119256830
Author:Amos Gilat
Publisher:John Wiley & Sons Inc
Probability and Statistics for Engineering and th...
Statistics
ISBN:9781305251809
Author:Jay L. Devore
Publisher:Cengage Learning
Statistics for The Behavioral Sciences (MindTap C...
Statistics
ISBN:9781305504912
Author:Frederick J Gravetter, Larry B. Wallnau
Publisher:Cengage Learning
Elementary Statistics: Picturing the World (7th E...
Statistics
ISBN:9780134683416
Author:Ron Larson, Betsy Farber
Publisher:PEARSON
The Basic Practice of Statistics
Statistics
ISBN:9781319042578
Author:David S. Moore, William I. Notz, Michael A. Fligner
Publisher:W. H. Freeman
Introduction to the Practice of Statistics
Statistics
ISBN:9781319013387
Author:David S. Moore, George P. McCabe, Bruce A. Craig
Publisher:W. H. Freeman