
MATLAB: An Introduction with Applications
6th Edition
ISBN: 9781119256830
Author: Amos Gilat
Publisher: John Wiley & Sons Inc
expand_more
expand_more
format_list_bulleted
Related questions
Question
What is the test statistic?
What is the p value?
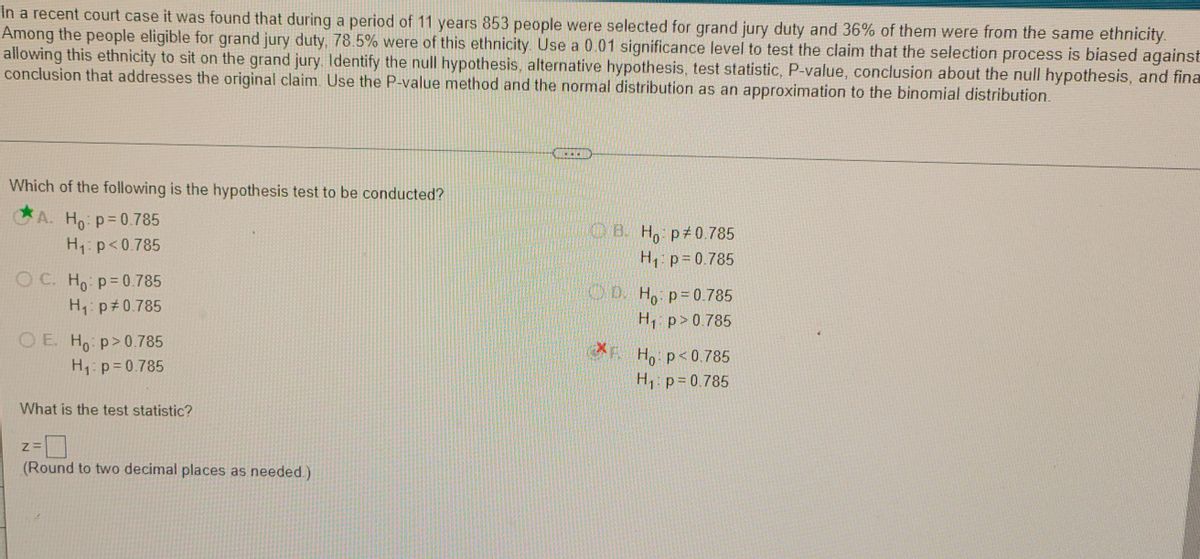

Transcribed Image Text:In a recent court case it was found that during a period of 11 years 853 people were selected for grand jury duty and 36% of them were from the same ethnicity.
Among the people eligible for grand jury duty, 78.5% were of this ethnicity. Use a 0.01 significance level to test the claim that the selection process is biased against
allowing this ethnicity to sit on the grand jury. ldentify the null hypothesis, alternative hypothesis, test statistic, P-value, conclusion about the null hypothesis, and fina
conclusion that addresses the original claim. Use the P-value method and the normal distribution as an approximation to the binomial distribution.
Which of the following is the hypothesis test to be conducted?
CA. Ho p= 0. 785
B. H, p 0 785
H1 p= 0.785
H1: p<0.785
O C. Ho p=0.785
OD. H, p=0.785
H, p#0.785
H, p>0 785
OE H p>0.785
H: p=0.785
XE
Ho p<0.785
H p=0.785
What is the test statistic?
(Round to two decimal places as needed.)
Expert Solution
This question has been solved!
Explore an expertly crafted, step-by-step solution for a thorough understanding of key concepts.

This is a popular solution

Trending nowThis is a popular solution!

Step by stepSolved in 2 steps with 1 images

Knowledge Booster

Similar questions
- What is the average score for those who work well with others in teams with the standard deviation?arrow_forwardTest the claim that the proportion of people who own cats is larger than 40% at the 0.1 significance level. Based on a sample of 500 people, 46% owned catsThe test statistic is: (to 2 decimals)The p-value is: (to 2 decimals)arrow_forwardFind the test statistic and p valuearrow_forward
- Example: 63 32 29 Q1: What is the value of your test statistic? Q2: What is the critical value from the F table? Q3: Doing a hypothesis test, is variance B greater than variance A? English (United States) C3 Focus 82arrow_forwardSummarize the similarities and differences between the one-sample t test, independent-measures t test, and repeated-measure t test.arrow_forwardExplain the difference between a one-tailed and two-tailed significance test. When is it appropriate to use each test?arrow_forward
- Test the claim that the proportion of people who own cats is significantly different than 50% at the 0.02 significance level. Based on a sample of 100 people, 58% owned catsThe test statistic is: (to 2 decimals)The p-value is: (to 2 decimals)arrow_forwardhat are the goals of random sampling? Can these goals be accomplished by randomizing participants instead? Why or why not? What are the goals of randomizing participants? Can these goals be accomplished by taking a random sample instead? Why or why not?arrow_forwardz Scores LeBron James, one of the most successful basketball players of all time, has a height of 6 feet 8 inches, or 203 cm. Based on statistics from Data Set 1 “Body Data” in Appendix B, his height converts to the z score of 4.07. How many standard deviations is his height above the mean?arrow_forward
- which statistical analysis correctly analyzes the repeated measures (also known as within subjects) design?arrow_forward1.Statistical Literacy Consider the mode, median, and mean. Which average represents the middle value of a data distribution? Which average represents the most frequent value of a distribution? Which average takes all the specific valuesinto account?arrow_forward
arrow_back_ios
arrow_forward_ios
Recommended textbooks for you
- MATLAB: An Introduction with ApplicationsStatisticsISBN:9781119256830Author:Amos GilatPublisher:John Wiley & Sons Inc
 Probability and Statistics for Engineering and th...StatisticsISBN:9781305251809Author:Jay L. DevorePublisher:Cengage Learning
 Statistics for The Behavioral Sciences (MindTap C...StatisticsISBN:9781305504912Author:Frederick J Gravetter, Larry B. WallnauPublisher:Cengage Learning
  Elementary Statistics: Picturing the World (7th E...StatisticsISBN:9780134683416Author:Ron Larson, Betsy FarberPublisher:PEARSON
 The Basic Practice of StatisticsStatisticsISBN:9781319042578Author:David S. Moore, William I. Notz, Michael A. FlignerPublisher:W. H. Freeman
 Introduction to the Practice of StatisticsStatisticsISBN:9781319013387Author:David S. Moore, George P. McCabe, Bruce A. CraigPublisher:W. H. Freeman
MATLAB: An Introduction with Applications
Statistics
ISBN:9781119256830
Author:Amos Gilat
Publisher:John Wiley & Sons Inc
Probability and Statistics for Engineering and th...
Statistics
ISBN:9781305251809
Author:Jay L. Devore
Publisher:Cengage Learning
Statistics for The Behavioral Sciences (MindTap C...
Statistics
ISBN:9781305504912
Author:Frederick J Gravetter, Larry B. Wallnau
Publisher:Cengage Learning
Elementary Statistics: Picturing the World (7th E...
Statistics
ISBN:9780134683416
Author:Ron Larson, Betsy Farber
Publisher:PEARSON
The Basic Practice of Statistics
Statistics
ISBN:9781319042578
Author:David S. Moore, William I. Notz, Michael A. Fligner
Publisher:W. H. Freeman
Introduction to the Practice of Statistics
Statistics
ISBN:9781319013387
Author:David S. Moore, George P. McCabe, Bruce A. Craig
Publisher:W. H. Freeman