
MATLAB: An Introduction with Applications
6th Edition
ISBN: 9781119256830
Author: Amos Gilat
Publisher: John Wiley & Sons Inc
expand_more
expand_more
format_list_bulleted
Related questions
Concept explainers
Topic Video
Question
I also need this answered ;
Based on the results, does it appear that men and women may have equal success in challenging calls?

Transcribed Image Text:**Hypothesis Testing in Tennis Tournament - Educational Example**
**Context:**
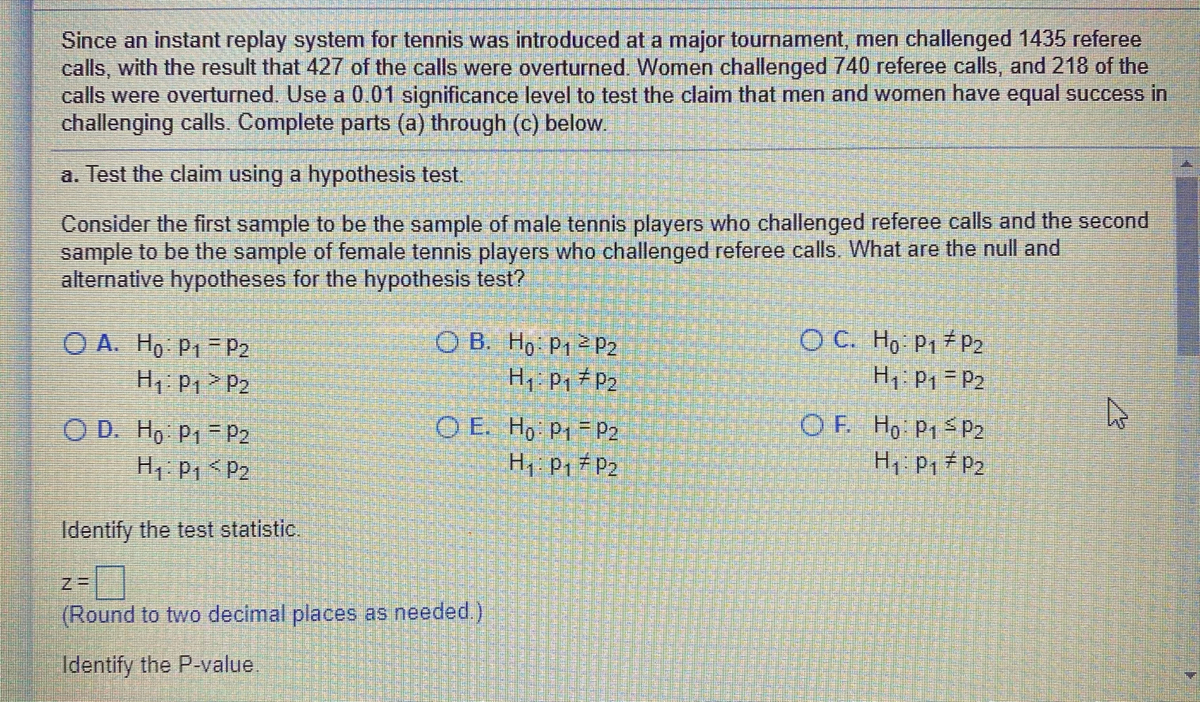
An instant replay system in tennis was introduced at a major tournament. In this event:
- Men challenged 1435 referee calls.
- Women challenged 740 referee calls.
- Out of these, 427 calls were overturned for men, and for women, 218 calls were overturned.
The objective is to test at a 0.01 significance level whether men and women have equal success rates in challenging calls.
**Hypothesis Testing:**
**Task:** Test the claim using a hypothesis test.
**Considerations:**
- First sample: Male tennis players challenging referee calls.
- Second sample: Female tennis players challenging referee calls.
**Objective:** Identify the null and alternative hypotheses for the hypothesis test.
**Options for Null (\( H_0 \)) and Alternative (\( H_1 \)) Hypotheses:**
- **A.** \( H_0: p_1 = p_2 \); \( H_1: p_1 > p_2 \)
- **B.** \( H_0: p_1 \geq p_2 \); \( H_1: p_1 \neq p_2 \)
- **C.** \( H_0: p_1 \neq p_2 \); \( H_1: p_1 = p_2 \)
- **D.** \( H_0: p_1 = p_2 \); \( H_1: p_1 < p_2 \)
- **E.** \( H_0: p_1 = p_2 \); \( H_1: p_1 \neq p_2 \)
- **F.** \( H_0: p_1 \leq p_2 \); \( H_1: p_1 \neq p_2 \)
**Statistical Analysis:**
**Identify the Test Statistic:**
- Calculate the test statistic (z-score) and round it to two decimal places.
**Identify the P-value:**
- Determine the P-value based on the calculated z-score.
This setup provides a structured format to guide students in formulating hypotheses and analyzing data for hypothesis testing in a real-world scenario.
![**Title: Statistical Analysis of Tennis Challenge Success Rates**
Since an instant replay system for tennis was introduced at a major tournament, men challenged 1435 referee calls, with the result that 427 of the calls were overturned. Women challenged 740 referee calls, and 218 of the calls were overturned. Use a 0.01 significance level to test the claim that men and women have equal success in challenging calls. Complete parts (a) through (c) below.
**Part (a): Hypothesis Test**
1. **Identify the Test Statistic:**
- \( z = \) [Box for input]
*(Round to two decimal places as needed)*
2. **Identify the P-value:**
- \( P\text{-value} = \) [Box for input]
*(Round to three decimal places as needed)*
3. **Conclusion Based on the Hypothesis Test:**
- The P-value is [Dropdown selection] the significance level of \( \alpha = 0.01 \), so [Dropdown selection] the null hypothesis. There [Dropdown selection] evidence to warrant rejection of the claim that women and men have equal success in challenging calls.
**Part (b): Confidence Interval**
- Test the claim by constructing an appropriate confidence interval. [Instructions for where to input the confidence interval calculations]
*Note: Students should ensure they understand how to compute the test statistic and the P-value accurately. Familiarity with hypothesis testing and confidence intervals is crucial for this exercise.*](https://content.bartleby.com/qna-images/question/3c4a10a4-f78a-4b33-baf7-d4cbff942cfa/9aabc6ba-7dc4-4b01-a394-667122de838e/q8ukv4e_processed.jpeg)
Transcribed Image Text:**Title: Statistical Analysis of Tennis Challenge Success Rates**
Since an instant replay system for tennis was introduced at a major tournament, men challenged 1435 referee calls, with the result that 427 of the calls were overturned. Women challenged 740 referee calls, and 218 of the calls were overturned. Use a 0.01 significance level to test the claim that men and women have equal success in challenging calls. Complete parts (a) through (c) below.
**Part (a): Hypothesis Test**
1. **Identify the Test Statistic:**
- \( z = \) [Box for input]
*(Round to two decimal places as needed)*
2. **Identify the P-value:**
- \( P\text{-value} = \) [Box for input]
*(Round to three decimal places as needed)*
3. **Conclusion Based on the Hypothesis Test:**
- The P-value is [Dropdown selection] the significance level of \( \alpha = 0.01 \), so [Dropdown selection] the null hypothesis. There [Dropdown selection] evidence to warrant rejection of the claim that women and men have equal success in challenging calls.
**Part (b): Confidence Interval**
- Test the claim by constructing an appropriate confidence interval. [Instructions for where to input the confidence interval calculations]
*Note: Students should ensure they understand how to compute the test statistic and the P-value accurately. Familiarity with hypothesis testing and confidence intervals is crucial for this exercise.*
Expert Solution
This question has been solved!
Explore an expertly crafted, step-by-step solution for a thorough understanding of key concepts.

This is a popular solution

Trending nowThis is a popular solution!

Step by stepSolved in 3 steps with 2 images

Knowledge Booster


Learn more about
Need a deep-dive on the concept behind this application? Look no further. Learn more about this topic, statistics and related others by exploring similar questions and additional content below.Similar questions
- I need to see if I am doing these problems correctly. I am more of a handwritten person so if you can show me how to write these out I would appreciate it for our teacher only shows us how to use a calculator. Nationally, patients who go to the emergency room wait an average of 7 hours to be admitted into the hospital. Do patients at rural hospitals have a lower waiting time? The 15 randomly selected patients who went to the emergency room at rural hospitals waited an average of 5.9 hours to be admitted into the hospital. The standard deviation for these 15 patients was 1.4 hours. What can be concluded at the the αα = 0.05 level of significance level of significance? For this study, we should use The null and alternative hypotheses would be: H0:H0: H1:H1: The test statistic = (please show your answer to 3 decimal places.) The p-value = (Please show your answer to 4 decimal places.) The p-value is αα Based on this, we should…arrow_forwardA research group conducted an extensive survey of 2940 wage and salaried workers on issues ranging from relationships with their bosses to household chores. The data were gathered through hour-long telephone interviews with a nationally representative sample. In response to the question, "What does success mean to you?" 1470 responded, "Personal satisfaction from doing a good job." Let p be the population proportion of all wage and salaried workers who would respond the same way to the stated question. How large a sample is needed if we wish to be 95% confident that the sample percentage of those equating success with personal satisfaction is within 1.6% of the population percentage? (Hint: Use p ≈ 0.50 as a preliminary estimate. Round your answer up to the nearest whole number.) workersarrow_forwardE) what other questions might this raise about the results ?arrow_forward
- Read the following problem description then choose the correct null and alternative hypothesis. A skeptical paranormal researcher claims that the proportion of Americans that have seen a UFO is less than 1 in every one thousand.arrow_forwardHello. Can I get help on how to work this problem? Thank You!arrow_forwardTo investigate whether it helps to have a "white-sounding" first name when looking for a job, the researchers sent 5,000 resumes in response to ads that appeared in magazines. The resumes were identical except that 2,500 of them had "white-sounding" first names, such as Brett and Emily, whereas the other 2,500 had "black-sounding" names such as Tamika and Rasheed. Resumes of the first type elicited 251 responses and resumes of the second type only 169 responses. A button hyperlink to the SALT program that reads: Use SALT. Do these data support the theory that the proportion receiving responses is greater for those resumes with "white-sounding first" names? (Use ? = 0.05. Use pwhite-sounding − pblack-sounding.) Find the test statistic. (Round your answer to two decimal places.) z = Find the P-value. (Round your answer to four decimal places.) P-value = State your conclusion. Reject H0. We have convincing evidence that the proportion eliciting responses is higher for…arrow_forward
- A survey of 150 freshmen business students at a local university produced the results listed below. How many students took only religion? 35 took history;42 took science;43 took religion;19 took history but not science;14 took science and religion;15 took history and religion;6 took all threearrow_forwardA study was conducted to determine whether big-city and small-town dwellers differed in their helpfulness to strangers. In this study, the investigators rang the doorbells of strangers living in a large City or small towns in the vicinity. They explained they had misplaced the address of a friend living in the neighbourhood and asked to use the phone. The following data show the number of individuals who admitted or did not admit the strangers (the investigators) into their homes: Helpfulness to strangers Admitted strangers into their home Didnot admit strangers into their home Big city dwellers 60 90 Small town dwellers 70 30 State the dependent and independent variable Is this a directional or non directionalarrow_forwardA company wants to study the effects a new drug has on alleviating pain. Some patients at doctor’s office are selected to be in the study. The patients will be randomly assigned to take the new drug or the old drug. They will be monitored to see when the pain goes away. The group getting the old drug is called what? A. Experiemental Group B. Control Group C. Dependent Group D. Independent Grouparrow_forward
arrow_back_ios
arrow_forward_ios
Recommended textbooks for you
- MATLAB: An Introduction with ApplicationsStatisticsISBN:9781119256830Author:Amos GilatPublisher:John Wiley & Sons Inc
 Probability and Statistics for Engineering and th...StatisticsISBN:9781305251809Author:Jay L. DevorePublisher:Cengage Learning
 Statistics for The Behavioral Sciences (MindTap C...StatisticsISBN:9781305504912Author:Frederick J Gravetter, Larry B. WallnauPublisher:Cengage Learning
  Elementary Statistics: Picturing the World (7th E...StatisticsISBN:9780134683416Author:Ron Larson, Betsy FarberPublisher:PEARSON
 The Basic Practice of StatisticsStatisticsISBN:9781319042578Author:David S. Moore, William I. Notz, Michael A. FlignerPublisher:W. H. Freeman
 Introduction to the Practice of StatisticsStatisticsISBN:9781319013387Author:David S. Moore, George P. McCabe, Bruce A. CraigPublisher:W. H. Freeman
MATLAB: An Introduction with Applications
Statistics
ISBN:9781119256830
Author:Amos Gilat
Publisher:John Wiley & Sons Inc
Probability and Statistics for Engineering and th...
Statistics
ISBN:9781305251809
Author:Jay L. Devore
Publisher:Cengage Learning
Statistics for The Behavioral Sciences (MindTap C...
Statistics
ISBN:9781305504912
Author:Frederick J Gravetter, Larry B. Wallnau
Publisher:Cengage Learning
Elementary Statistics: Picturing the World (7th E...
Statistics
ISBN:9780134683416
Author:Ron Larson, Betsy Farber
Publisher:PEARSON
The Basic Practice of Statistics
Statistics
ISBN:9781319042578
Author:David S. Moore, William I. Notz, Michael A. Fligner
Publisher:W. H. Freeman
Introduction to the Practice of Statistics
Statistics
ISBN:9781319013387
Author:David S. Moore, George P. McCabe, Bruce A. Craig
Publisher:W. H. Freeman