
MATLAB: An Introduction with Applications
6th Edition
ISBN: 9781119256830
Author: Amos Gilat
Publisher: John Wiley & Sons Inc
expand_more
expand_more
format_list_bulleted
Related questions
Concept explainers
Question
thumb_up100%
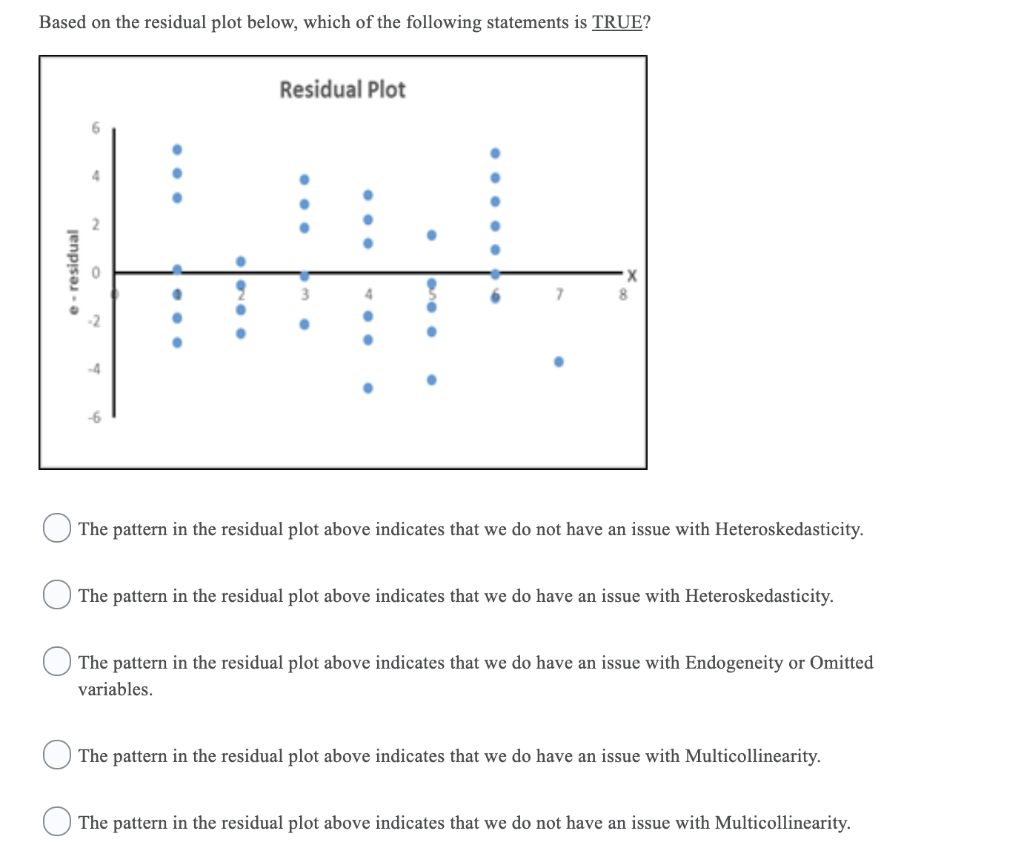

Transcribed Image Text:Based on the residual plot below, which of the following statements is TRUE?
Residual Plot
7.
8.
The pattern in the residual plot above indicates that we do not have an issue with Heteroskedasticity.
The pattern in the residual plot above indicates that we do have an issue with Heteroskedasticity.
The pattern in the residual plot above indicates that we do have an issue with Endogeneity or Omitted
variables.
The pattern in the residual plot above indicates that we do have an issue with Multicollinearity.
The pattern in the residual plot above indicates that we do not have an issue with Multicollinearity.
residual
..
Expert Solution
This question has been solved!
Explore an expertly crafted, step-by-step solution for a thorough understanding of key concepts.

This is a popular solution

Trending nowThis is a popular solution!

Step by stepSolved in 2 steps

Knowledge Booster


Learn more about
Need a deep-dive on the concept behind this application? Look no further. Learn more about this topic, statistics and related others by exploring similar questions and additional content below.Similar questions
- What happens when you overfit a regression model? Question 25 options: The model captures too much of the random variation in the sample data and fails to predict accurately for the population. The p-value for the F-test of overall significance is greater than 0.05. So many variables are added to the model that the Adjusted {"version":"1.1","math":"<math xmlns="http://www.w3.org/1998/Math/MathML"><msup><mi>R</mi><mn>2</mn></msup></math>"} value exceeds 1 None of the relationships in the model are found to be statistically significant.arrow_forward5arrow_forwardThe data in personalities is bivariate normally distributed Carry out a formal t-test for the association between extroversion and neuroticism in personalities H0: The population correlation coefficient is 0. HA: The population correlation coefficient is not 0. What is the value of the t-statistic corresponding to this test? Carry out a formal t-test for the association between extroversion and neuroticism in personalities. H0: The population correlation coefficient is 0. HA: The population correlation coefficient is not 0. What is the critical value of the t-statistic required to reject the null hypothesis at a confidence level of 0.05arrow_forward
- Could you help me with these 2 pleasearrow_forward(d) Perfect negative linear.corelation 60--1 (g) No linear correlation (linearly uncorrelated) Sep 5-3:11 PM Remember the stork example? Correlation does not always mean causation! Two variables may be strongly correlated because they are both variables, called lurking or confounding variables. June 15, 2020-- Research shows bald men are more llkely to die after they get the coronavirus than their hairier counterparts Since the vtus emerged in China, researchers have noticed a higher incidence of death Telegraph in England. Jn 15 2020 -age bald men reported The -ma >Coronavirus ticws Pta wwe.datymat.co.uknews/articie-854804. Coronavina-study-daims.nomt The Real Cause of Polio! Polio Rates / Ice Cream Sales 1949 0000 ke Creamm Nonth In the late 1940s, before there was a polio vaccine, public health experts In America noted that polio cases increased in step with the consumption of ice cream and soft drinks, Eliminating such treats was even recommended as part of an anti-polio diet. It…arrow_forwardIm regressing a model with an endogenous variable as an independent variable, and using the Multiple Indicator approach. Whats assumptions needed for the Betas to be “identified”, and separately the Beta estimates to be “consistent”? What do we mean by “identified” and “consistent”?arrow_forward
- Current Attempt in Progress State the null and alternative hypotheses for the situation described below for a statistical test. Testing to see if there is evidence that the proportion of people who smoke is greater for males than for females. Let group 1 be the males and let group 2 be the females. Ho: = < vs Ha: 41 :: p 2 :: p ^ P₁ P1 ^ :: P2 P2 p I ₁ :: I₂arrow_forwardWhy is it that my standard residuals appear to be non-linear yet the rest of my results appear linear? What does this imply in context to the topic? (strengths dependency on weight). If there is something wrong with my R script please let me know. Or if there is a reason as to why this has happened.arrow_forward
arrow_back_ios
arrow_forward_ios
Recommended textbooks for you
- MATLAB: An Introduction with ApplicationsStatisticsISBN:9781119256830Author:Amos GilatPublisher:John Wiley & Sons Inc
 Probability and Statistics for Engineering and th...StatisticsISBN:9781305251809Author:Jay L. DevorePublisher:Cengage Learning
 Statistics for The Behavioral Sciences (MindTap C...StatisticsISBN:9781305504912Author:Frederick J Gravetter, Larry B. WallnauPublisher:Cengage Learning
  Elementary Statistics: Picturing the World (7th E...StatisticsISBN:9780134683416Author:Ron Larson, Betsy FarberPublisher:PEARSON
 The Basic Practice of StatisticsStatisticsISBN:9781319042578Author:David S. Moore, William I. Notz, Michael A. FlignerPublisher:W. H. Freeman
 Introduction to the Practice of StatisticsStatisticsISBN:9781319013387Author:David S. Moore, George P. McCabe, Bruce A. CraigPublisher:W. H. Freeman
MATLAB: An Introduction with Applications
Statistics
ISBN:9781119256830
Author:Amos Gilat
Publisher:John Wiley & Sons Inc
Probability and Statistics for Engineering and th...
Statistics
ISBN:9781305251809
Author:Jay L. Devore
Publisher:Cengage Learning
Statistics for The Behavioral Sciences (MindTap C...
Statistics
ISBN:9781305504912
Author:Frederick J Gravetter, Larry B. Wallnau
Publisher:Cengage Learning
Elementary Statistics: Picturing the World (7th E...
Statistics
ISBN:9780134683416
Author:Ron Larson, Betsy Farber
Publisher:PEARSON
The Basic Practice of Statistics
Statistics
ISBN:9781319042578
Author:David S. Moore, William I. Notz, Michael A. Fligner
Publisher:W. H. Freeman
Introduction to the Practice of Statistics
Statistics
ISBN:9781319013387
Author:David S. Moore, George P. McCabe, Bruce A. Craig
Publisher:W. H. Freeman