
MATLAB: An Introduction with Applications
6th Edition
ISBN: 9781119256830
Author: Amos Gilat
Publisher: John Wiley & Sons Inc
expand_more
expand_more
format_list_bulleted
Related questions
Question
Obtain the studentized deleted residuals. Which case has the largest absolute value studentized deleted residual?
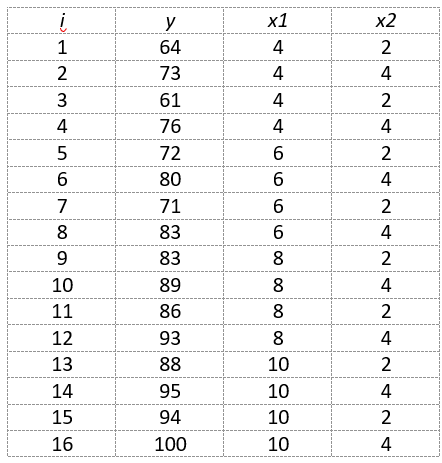

Transcribed Image Text:į
1
2
3
4
5
6
7
8
9
10
11
12
13
14
15
16
y
64
73
61
76
72
80
71
83
83
89
86
93
88
95
94
100
x1
4
4
4
4666680 00 00 00 999
8
10
10
10
10
x2
2
42424
2
4
2
4
2
4
2
4
2
4
Expert Solution
This question has been solved!
Explore an expertly crafted, step-by-step solution for a thorough understanding of key concepts.

This is a popular solution

Trending nowThis is a popular solution!

Step by stepSolved in 2 steps with 2 images

Follow-up Questions
Read through expert solutions to related follow-up questions below.
Follow-up Question
The spreadsheet above does not generate when I choose Regression. How do I generate the attached spreadsheet?

Transcribed Image Text:Observationyi
1
2
3
4
5
6
7
8
9
10
11
12
13
14
15
16
Predicted ResidualLeverageResidual
64.0 64.1
73.0 72.9
61.0 64.1
76.0 72.9
72.0 73.0
80.0 81.7
71.0 73.0
83.0 81.7
83.0 81.8
89.0 90.6
86.0 81.8
93.0 90.6
88.0 90.7
95.0 99.4
94.0 90.7
100.099.4
StudentizedDeleted
Studentizec
-0.1 0.238 -0.043
0.2
0.238
0.064
-3.1
0.238
-1.318
3.2 0.238
1.339
-0.9
0.138
-0.380
-1.7 0.138
-0.680
-1.9
0.138 -0.780
1.3
0.138 0.520
1.2
0.138 0.480
-1.6 0.138
-0.620
4.2
0.138
1.679
2.5
0.138 0.979
-2.6
0.238
-1.127
-4.4 0.238
-1.871
3.4
0.238
1.424
0.6
0.238 0.255
Residual
-0.041
0.061
-1.361
1.386
-0.367
-0.665
-0.767
0.505
0.465
-0.604
1.823
0.978
-1.140
-2.103
1.490
0.246
Solution
by Bartleby Expert
Follow-up Questions
Read through expert solutions to related follow-up questions below.
Follow-up Question
The spreadsheet above does not generate when I choose Regression. How do I generate the attached spreadsheet?
Transcribed Image Text:Observationyi
1
2
3
4
5
6
7
8
9
10
11
12
13
14
15
16
Predicted ResidualLeverageResidual
64.0 64.1
73.0 72.9
61.0 64.1
76.0 72.9
72.0 73.0
80.0 81.7
71.0 73.0
83.0 81.7
83.0 81.8
89.0 90.6
86.0 81.8
93.0 90.6
88.0 90.7
95.0 99.4
94.0 90.7
100.099.4
StudentizedDeleted
Studentizec
-0.1 0.238 -0.043
0.2
0.238
0.064
-3.1
0.238
-1.318
3.2 0.238
1.339
-0.9
0.138
-0.380
-1.7 0.138
-0.680
-1.9
0.138 -0.780
1.3
0.138 0.520
1.2
0.138 0.480
-1.6 0.138
-0.620
4.2
0.138
1.679
2.5
0.138 0.979
-2.6
0.238
-1.127
-4.4 0.238
-1.871
3.4
0.238
1.424
0.6
0.238 0.255
Residual
-0.041
0.061
-1.361
1.386
-0.367
-0.665
-0.767
0.505
0.465
-0.604
1.823
0.978
-1.140
-2.103
1.490
0.246
Solution
by Bartleby Expert
Knowledge Booster

Similar questions
- A correlation of +.20 means that [blank] of the variance in the outcome variable is accounted for by the predictor variable.arrow_forwardIn multiple linear regression, the Variance Inflation Factor (VIF) measures multicollinearity among the X-variables. What is multicollinearity, and why do we want to avoid it?arrow_forwardAssume that a high school principal believes that high number of absences hinders the students' ability to perform on standardized tests. He randomly selects a sample of 9 students who had 5 or more absences in the school year. The average ACT Composite score for this sample is X = 19 with s = 4.9. ACT Composite scores are normally distributed with u = 21.0. Do the data support the claim that the high number of absences hinders the students' ability to perform on standardized tests, using a = .05? Please show the four-step hypothesis test. %3Darrow_forward
arrow_back_ios
arrow_forward_ios
Recommended textbooks for you
- MATLAB: An Introduction with ApplicationsStatisticsISBN:9781119256830Author:Amos GilatPublisher:John Wiley & Sons Inc
 Probability and Statistics for Engineering and th...StatisticsISBN:9781305251809Author:Jay L. DevorePublisher:Cengage Learning
 Statistics for The Behavioral Sciences (MindTap C...StatisticsISBN:9781305504912Author:Frederick J Gravetter, Larry B. WallnauPublisher:Cengage Learning
  Elementary Statistics: Picturing the World (7th E...StatisticsISBN:9780134683416Author:Ron Larson, Betsy FarberPublisher:PEARSON
 The Basic Practice of StatisticsStatisticsISBN:9781319042578Author:David S. Moore, William I. Notz, Michael A. FlignerPublisher:W. H. Freeman
 Introduction to the Practice of StatisticsStatisticsISBN:9781319013387Author:David S. Moore, George P. McCabe, Bruce A. CraigPublisher:W. H. Freeman
MATLAB: An Introduction with Applications
Statistics
ISBN:9781119256830
Author:Amos Gilat
Publisher:John Wiley & Sons Inc
Probability and Statistics for Engineering and th...
Statistics
ISBN:9781305251809
Author:Jay L. Devore
Publisher:Cengage Learning
Statistics for The Behavioral Sciences (MindTap C...
Statistics
ISBN:9781305504912
Author:Frederick J Gravetter, Larry B. Wallnau
Publisher:Cengage Learning
Elementary Statistics: Picturing the World (7th E...
Statistics
ISBN:9780134683416
Author:Ron Larson, Betsy Farber
Publisher:PEARSON
The Basic Practice of Statistics
Statistics
ISBN:9781319042578
Author:David S. Moore, William I. Notz, Michael A. Fligner
Publisher:W. H. Freeman
Introduction to the Practice of Statistics
Statistics
ISBN:9781319013387
Author:David S. Moore, George P. McCabe, Bruce A. Craig
Publisher:W. H. Freeman