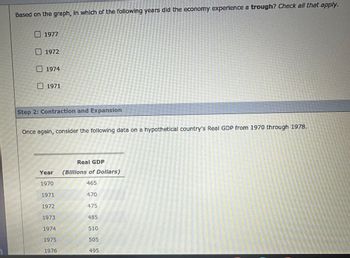
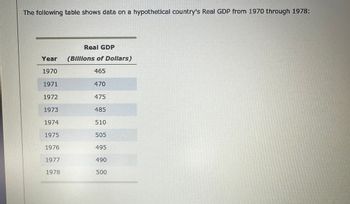
Based on the graph, in which of the following years did the economy experience a trough? Check all that apply. 1977 1972 1974 ☐ 1971 Step 2: Contraction and Expansion Once again, consider the following data on a hypothetical country's Real GDP from 1970 through 1978. Year Real GDP (Billions of Dollars) 1970 465 1971 470 1972 475 1973 485 1974 510 1975 505 1976 495 The following table shows data on a hypothetical country's Real GDP from 1970 through 1978: Real GDP Year (Billions of Dollars) 1970 465 1971 470 1972 475 1973 485 1974 510 1975 505 1976 495 1977 490 1978 500
Q: Your son is graduating from high school and is about to enter the work force. He has developed a…
A: Absolute and Comparative Advantage are fundamental to understanding international trade. Absolute…
Q: Don't use Ai and chatgpt. Answer in step by step with explanation.
A: The tax's implementation raises the market price while lowering the quantity demanded. The price…
Q: Don't use Ai
A: To figure out how many more pizzas the economy can produce after the shift from PPF1 to PPF2, I need…
Q: D Use the graph below to answer the following questions: (you can identify an area by using the…
A: Ans. ) Given the question is related to the concept of consumer surplus and producer…
Q: Question 3 Compromiser O "When you don't help with the dishes, I feel frustrated." O Disagreements…
A: Option C: A compromiser is someone who aims to find a balance between the conflicting parties by…
Q: not use ai please don't
A: here is the table filled that you have given in your question buddy. Sequoia Glacier Chinos…
Q: In the figure to the right, what are the effects of a price increase from $44 per wireless earbud…
A: 1. Market demand curveThe market demand is the combination of the demand per price level of all the…
Q: Use the supply schedule below to answer the questions that follow. Supply of Flower Bouquets Price…
A: Answer 1:Supply Schedule (From the table):At $40, 90 bouquets are supplied.At $35, 70 bouquets are…
Q: None
A: 4.3 Proving that Merger Increases Profits and Consumer SurplusA merger between two monopolists…
Q: Don't use Ai and chatgpt. Answer in step by step with explanation.
A: Here is the analysis of the attributes in relation to competitive markets and monopolistically…
Q: How is wealth distribution in the united state of America? What percentage of the population have a…
A: 1. Top 1% of the Population:Wealth Control: The wealthiest 1% of the population controls…
Q: not use ai please
A: Understanding the Problem:Ana and Dina are engaged in two activities: making pizza and brewing root…
Q: Briefly explain about the company or the product which you chose. (Mention the background, vision,…
A: 1. Company BackgroundTo expand on Target's background, we can delve into its origins and evolution…
Q: help please answer in text form with proper workings and explanation for each and every part and…
A: We are given;The U.S. can produce either 10 units of M&Ms or 10 units of Sour Patch Kids.Mexico…
Q: Please correct answer and don't use hand rating
A: b. Finding equilibrium pricesGiven pT=100, the equilibrium prices for Mining (pM), Lumber (pL),…
Q: None
A: Consumer Surplus is the difference between what the consumer is willing to pay for a particular good…
Q: 不 The data in the table below represent different demand and supply curves. According to the data in…
A: Table Summary:The table shows the relationship between price, quantity supplied, and quantity…
Q: A demand curve shows the quantity of a good that buyers Multiple Choice have actually purchased…
A: A key idea in economics, the demand curve illustrates the relationship between a good's price and…
Q: not use ai please
A: Economic Analysis of Michigan Blueberry MarketIntroductionThis document provides an economic…
Q: Consider the relationship between the number of bids an item on eBay received and the item's selling…
A: Given:Price in DollarsNumber of Bids20142315291638174119In this problem, the independent variable…
Q: Included the information in the pics
A: 1. The graph shows that the current market equilibrium is at 8% interest rate with $300 million in…
Q: Don't use Ai and chatgpt. Answer in step by step with explanation.
A: To calculate the consumer surplus and producer surplus:1. Consumer Surplus (CS)Consumer surplus…
Q: What is/are the Nash equilibrium/equilibria of Game 1.7? (If you think there is more than one NE,…
A: It is necessary to conduct an analysis of the strategic interactions that take place between the…
Q: Please correct answer and don't use hand rating
A: I have applied these calculations for the first five years (2000-2004). The same process can be…
Q: Answer in step by step with explanation. Don't use Ai and chatgpt
A: ConclusionIt's clear that Anat's choice to close down has led to less consumer surplus. By leaving…
Q: 9. Beth earns $500 per month as a college student. She spends $100 on groceries and she splits the…
A: The graph above shows the budget constraints for Beth's grocery spending under three different…
Q: D Question 10 Request statement 田 1 pts OA person who seeks to "find the middle ground" or "split…
A: Approach to Solving the Question:Identify Key Terms: The term "request statement" points toward…
Q: 1. a) Should minimum wage be mandated by the government or should the price of labor be established…
A: a) A comparison of market-determined wages with government-mandated wagesMinimum rate of pay imposed…
Q: The United States is one of the most heavily regulated economies in the world. Do we have too many…
A: Approach to Solving the Question: To address whether the United States has too many or too few laws…
Q: How would you distribute a free urgent care clinic if this is a production businesss? How good is…
A: Location and ProximityWhen distributing a free urgent care clinic in downtown Detroit, proximity to…
Q: Suppose that Ned can produce either potato chips or computer chips. If he only produces potato chips…
A: Analyzing the Production Possibilities Frontier (PPF)Understanding the Problem:We are given a…
Q: Don't use ai i will report you answer solve it as soon as possible with proper explanation
A: From the given table, we can see that at combination D, Deborah produces 1 crochet hat and 19…
Q: 1. Solve the following system of equations for x, y, and z. 3x+5yz-12 2x-3y+2z = 22 x+4y-3z = -10 2.…
A: 1) We will solve this system using the method of substitution or elimination. Let's proceed with…
Q: The following table shows a sample of the amount spent for lunch by 8 students Lunch Spending ($) =…
A: Given:28, 10, 1, 15, 8, 6, 10, 6 The sample mean is calculated as the sum of the observations…
Q: What can Uber do to ensure its competitors are not chipping away at its dominant market share due to…
A: Uber can start by improving its public relations. This involves managing the spread of information…
Q: Don't use Ai and chatgpt. Answer in step by step with explanation
A: Jimmy makes the following deposits:$4,200 now (Year 0),$2,300 three years from now (Year 3),$5,000…
Q: The following graph shows the weekly market for handbags in some hypothetical economy. Suppose the…
A: Key Elements of the Graph:1. Supply and Demand Curves:- The orange line represents the supply curve,…
Q: Consider an economy that produces two goods: X and Y. The following two graphs (A and B) each depict…
A: Step 1: Graph A shows an outward shift of the PPF along the Y-axis, while the X-axis remains…
Q: Don't use Ai
A: When we say that individuals as a group are net suppliers of funds for financial institutions, it…
Q: Show the steps and take a like
A: Step 3: Solve for Nash EquilibriaIn the reduced matrix, we look for cells where neither player has…
Q: For some consumers, bus travel is an inferior good, since they decrease their consumption when…
A: Analyzing the Impact of Lower Bus Fares on Consumer Behavior In general, the assertion is false.…
Q: Price Competition in the Manhattan Pizza Market Bombay/6 Ave. Pizza and Joey Pepperoni’s Pizza are…
A: Step 1:a) Appropriate Economic ModelThe Bertrand competition model is a model of price competition…
Q: Don't use ai i will report you answer solve it as soon as possible with proper explanation
A: The production possibilities frontier (PPF) shows the potential production levels of Deborah given…
Q: I need typing clear urjent no chatgpt used i will give 5 upvotes pls full explain
A: Analyze the free-body diagram of the system. Apply the equation of equilibrium along the moment…
Q: Gavin is consuming beer and pizza such that his marginal rate of substitution between beer and pizza…
A: Budget ConstraintA budget constraint represents all possible combinations of goods that a consumer…
Q: Answer in step by step with explanation. Don't use Ai and chatgpt.
A: To solve for the quota rent in this taxi market, let's break it down step-by-step:Market…
Q: not use ai please
A: Step 1:Step 2:Step 3:
Q: In figure 3-8, using supply and demans curves denoted S1 and D1, respectively, the equilibrium price…
A: Part 2: ExplanationEquilibrium in Supply and Demand: The equilibrium point is where the quantity…
Q: 8. The impact of international capital flows Suppose that the following graph depicts the market for…
A: Ans. ) Given the question is related to the concept of the impact of international capital flows.…
Q: None
A: The problem presented is about Thirsty Ed, who drinks pure spring water available in two…
Step by step
Solved in 2 steps
- The following table shows data on a hypothetical country's real GDP from 1980 through 1988: Real GDP Year (Billions of Dollars) 1980 372 1981 380 1982 384 404 400 388 392 400 404 Use the blue points (circle symbol) to plot the real GDP in each of the years listed. (Note: Plot your points in the order in which you would like them connected. Line segments will connect the points automatically.) Next, place the black point (plus symbol) on the graph to indicate the point on the real GDP curve that definitely represents a peak. Finally, place the grey point (star symbol) on the graph to indicate the point on the real GDP curve that definitely represents a trough. REAL GDP (Billions of cordis 1983 1984 1985 1986 1987 1988 ROWTH RATE (Percent 440 432 424 410 408 400 382 304 378 388 360 -1 -3 -4 Growth trend 5 1980 1981 1982 1983 1984 1081 Once you've calculated the percentage change for each of the years, use the orange points (square symbol) to plot your results on the following graph,…How many recessions has France undergone over the years plotted in the chart? What are the two biggest recessions in terms of length and magnitude? Answer the questions from the figure given.Consider the following data on U.S. GDP: Year Nominal GDP GDP Deflator (Billions of dollars) (Base year 2009) 2016 18,707 105.93 1996 8,073 73.18 The growth rate of nominal GDP between 1996 and 2016 was , and the growth rate of the GDP deflator between 1996 and 2016 was . (Hint: The growth rate of a variable XX over an NN-year period is calculated as 100×((XfinalXinitial)(1N)−1)100×XfinalXinitial1N−1) Measured in 2009 prices, real GDP was billion in 1996 and billion in 2016. (Note: Select the answers closest to the values you compute.) The growth rate of real GDP between 1996 and 2016 was . The growth rate of nominal GDP between 1996 and 2016 was than the growth rate of real GDP.
- Assume an economy consumes only two goods: food and clothing. The prices and quantities produced domestically of each good for two different years are shown in the table below. Year 1 quantity Year 2 quantity Year 1 price Year 2 price Food 5000 5500 $2 $5 Clothing 1000 1200 $30 $25 What is the nominal GDP for year 2? What is the real GDP for year 2, using year 1 as the base year? What is the GDP deflator? (2 decimal places) What was the result on the overall price level? no ch increased decreasedAssume all of the cheese are used in the production of the cheeseburgers. Also assume that Year 1 is the base year.Using data from Table 19.5 how much of the nominal GDP growth from 1980 to 1990 was real GDP and how much was inflation?
- Consider the following data on U.S. GDP: Year Nominal GDP (in billions of dollars) GDP Deflator (base year 2009) 2014 17,419 108.3 1994 7,309 73.8 Answer the following questions. Please explain in detail of your calculation (if needed). 1. What is GDP Deflator? What does it mean when GDP Deflator in 2014 was 108.3? 2. What was the growth rate of nominal GDP between 1994 and 2014? 3. What was the growth rate of GDP Deflator between 1994 and 2014? 4. What was real GDP in 1994 and 2014 measured in 2009 prices?The following table shows Spain’s (annualized) quarterly real GDP growth rates for the 2007–2012 period. (Roman numbers refer to quarters.) a) Plot real GDP growth rate in a graph, and identify a trend in the data. b) Based on the data shown, identify the beginning (i.e., the year and the quarter) of the current recession.How would I fill this out?
- The following graph approximates business cycles in the United States from the first quarter of 1955 to the third quarter of 1959. The vertical blue bar coincides with a period of six or more months of declining real gross domestic product (real GDP). Notice that real GDP trends upward over time but experiences ups and downs in the short run. A period of increasing real GDP is known as a __________ (options: bust, business cycle, boom).Please answer the questions provided on the image below.The following table shows data on a hypothetical country's Real GDP from 1970 through 1978: Real GDP Year (Billions of Dollars) 1970 465 1971 470 1972 475 1973 485 1974 510 1975 505 1976 495 1977 490 1978 500 The green line on the following graph shows the economy's long-term growth trend. Lise the blue points (circle symbol) to plot the Real GDP in each of the years listed. (Note: Plot your points in the order in which you would like them connected. Line segments will connect the points automatically.) Next, place the black point (plus symbol) on the graph to indicate the point on the Real GDP curve that delinitely represents a peak. Finally, place the grey point (star symbol) on the graph to indicate the point on the Real GDP curve that delinitely represents a trough. 550 540 Real GDP 530 520 510 Peak 500 490 Traugh Growth trend 480 470 460 450 1970 1971 1972 1973 1974 1975 1978 1977 1978 YEAR Calculate the percentage change in Real GDP in each of the years shown. (Hint: The…