
MATLAB: An Introduction with Applications
6th Edition
ISBN: 9781119256830
Author: Amos Gilat
Publisher: John Wiley & Sons Inc
expand_more
expand_more
format_list_bulleted
Related questions
Question
![Based on the data shown below, calculate the regression line (each value to one decimal place).
\[ \hat{y} = \ \text{_} \ x + \ \text{_} \]
| x | y |
|----|-------|
| 1 | 11.15 |
| 2 | 10.9 |
| 3 | 11.55 |
| 4 | 11.4 |
| 5 | 13.65 |
| 6 | 12.4 |
| 7 | 14.35 |
| 8 | 14.5 |
| 9 | 14.75 |
| 10 | 13 |
| 11 | 13.85 |
| 12 | 12.6 |
| 13 | 13.65 |
| 14 | 15.3 |
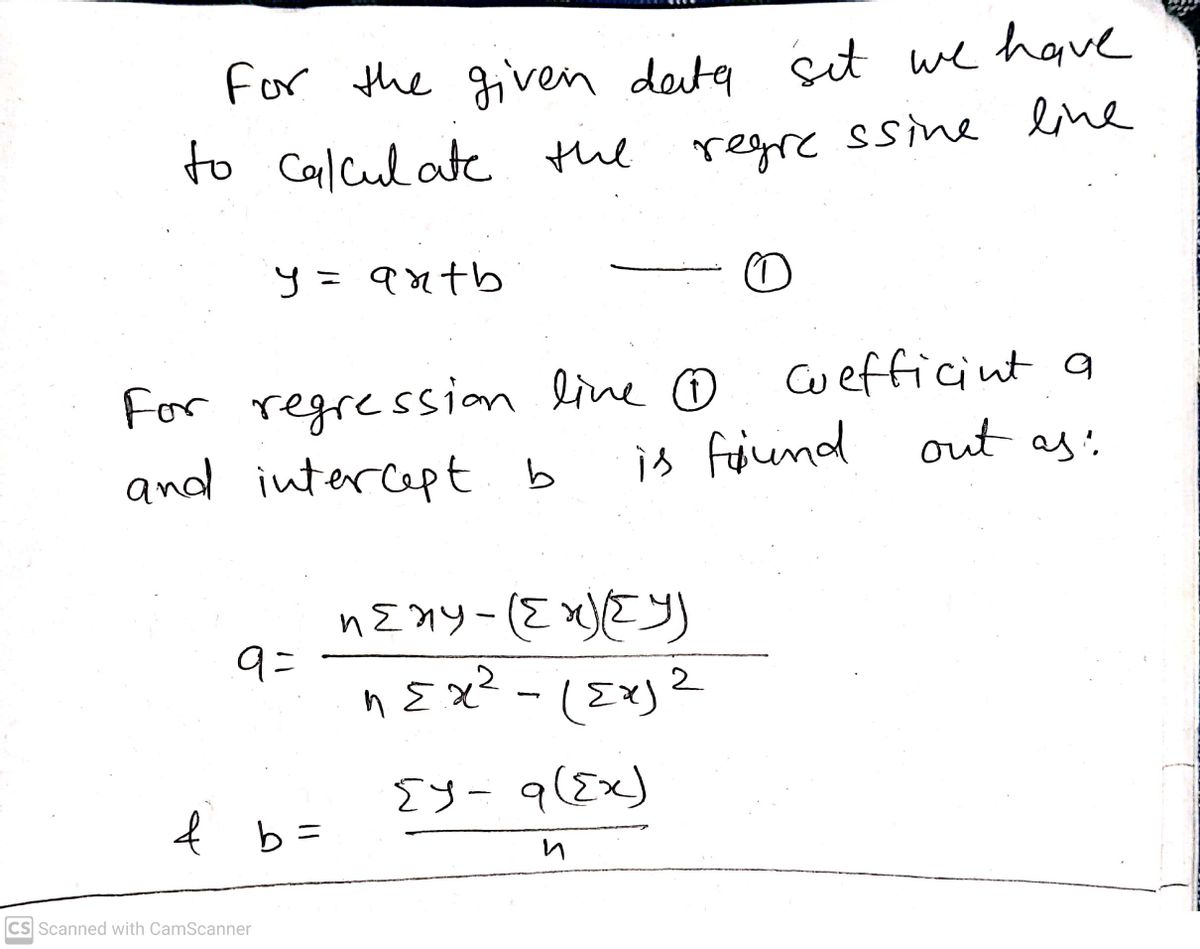
To solve this, use the formula for the least squares regression line:
\[ \hat{y} = a + bx \]
where \( b \) is the slope and \( a \) is the y-intercept, calculated using:
\[ b = \frac{n(\sum xy) - (\sum x)(\sum y)}{n(\sum x^2) - (\sum x)^2} \]
\[ a = \frac{\sum y - b(\sum x)}{n} \]
Calculate \( \sum x \), \( \sum y \), \( \sum xy \), and \( \sum x^2 \) using the data provided, then substitute these into the formulas to find \( a \) and \( b \).](https://content.bartleby.com/qna-images/question/97b5df25-1667-438a-b46e-c2a0d1ae7c86/cc5f2e76-2278-4f13-b10a-cb267dbedbc7/lya71at_processed.jpeg)

Transcribed Image Text:Based on the data shown below, calculate the regression line (each value to one decimal place).
\[ \hat{y} = \ \text{_} \ x + \ \text{_} \]
| x | y |
|----|-------|
| 1 | 11.15 |
| 2 | 10.9 |
| 3 | 11.55 |
| 4 | 11.4 |
| 5 | 13.65 |
| 6 | 12.4 |
| 7 | 14.35 |
| 8 | 14.5 |
| 9 | 14.75 |
| 10 | 13 |
| 11 | 13.85 |
| 12 | 12.6 |
| 13 | 13.65 |
| 14 | 15.3 |
To solve this, use the formula for the least squares regression line:
\[ \hat{y} = a + bx \]
where \( b \) is the slope and \( a \) is the y-intercept, calculated using:
\[ b = \frac{n(\sum xy) - (\sum x)(\sum y)}{n(\sum x^2) - (\sum x)^2} \]
\[ a = \frac{\sum y - b(\sum x)}{n} \]
Calculate \( \sum x \), \( \sum y \), \( \sum xy \), and \( \sum x^2 \) using the data provided, then substitute these into the formulas to find \( a \) and \( b \).
Expert Solution
arrow_forward
Step 1

Step by stepSolved in 3 steps with 3 images

Knowledge Booster

Similar questions
- Based on the data shown below, calculate the regression line (each value to two decimal places)y = x + x y 5 16.8 6 12.4 7 10.3 8 9.9 9 5.6 10 6.2 11 2.9arrow_forwardBased on the data shown below, calculate the regression line (each value to at least two decimal places)y =___x +____ x y 4 12.5 5 10.7 6 11 7 12.7 8 12.5 9 16.9 10 14.2 11 17 12 15.6arrow_forwardBased on the data shown below, calculate the regression line (each value to two decimal places)y = x + x y 1 9.42 2 13.44 3 17.06 4 18.38 5 22.5 6 21.42 7 27.64 8 29.66arrow_forward
- Based on the data shown below, calculate the regression line (each value to two decimal places) y = X + Enter an integer or decimal number [more..] X y 18.66 20.18 5 21.4 6 22.22 7 21.44 8 23.56 9 22.28 10 22.6 3 4arrow_forwardAnnual high temperatures in a certain location have been tracked for several years. Let X represent the year and Y the high temperature. Based on the data shown below, calculate the regression line (each value to two decimal places). y = X+ y 1 30.12 2 30.98 3 26.34 4 23.8 5 25.46 6 20.02 7 19.68 8 17.64 9 17.7 16.26 10 11 14.32 12 11.88 13 9.94 14 6.8 Question Help: Video Message instructor Submit Question Jump to Answer 80 F3 F4 F2 W 6 X H H # 3 E D $ R FL % F5 T 6 MacBook Air F6 & 7 Y G H AA F7 U * 00 8 J DII F8 I ( 9 DD F9 K 0arrow_forwardBased on the data shown below, calculate the regression line (each value to at least two decimal places)______ y = x + ______ x y 2 40.26 3 39.47 4 37.88 5 36.09 6 30.8 7 30.41 8 28.72 9 23.93 10 22.94 11 21.35 12 16.96 13 14.87 14 14.98 15 9.29 16 10.5arrow_forward
- Based on the data shown below, calculate the regression line (each value to two decimal places) %3D y 13.28 13.41 13.94 8. 10.37 9. 13.7 10 11.03 11 12.46 12 9.99 13 8.82 14 10.55 15 9.18 16 9.81 17 9.84 18 9.47 19 9.2 670arrow_forwardBased on the data shown below, calculate the regression line (each value to at least two decimal places)y =______ x + _______ x y 2 28.72 3 25.76 4 22.9 5 23.14 6 21.58 7 15.72 8 15.86 9 13.9arrow_forwardBased on the data shown below, calculate the regression line (show each value to two decimal places) 19.28 6 17.75 16.62 8 16.69 14.76 10 13.33 11 11.6 y =arrow_forward
arrow_back_ios
arrow_forward_ios
Recommended textbooks for you
- MATLAB: An Introduction with ApplicationsStatisticsISBN:9781119256830Author:Amos GilatPublisher:John Wiley & Sons Inc
 Probability and Statistics for Engineering and th...StatisticsISBN:9781305251809Author:Jay L. DevorePublisher:Cengage Learning
 Statistics for The Behavioral Sciences (MindTap C...StatisticsISBN:9781305504912Author:Frederick J Gravetter, Larry B. WallnauPublisher:Cengage Learning
  Elementary Statistics: Picturing the World (7th E...StatisticsISBN:9780134683416Author:Ron Larson, Betsy FarberPublisher:PEARSON
 The Basic Practice of StatisticsStatisticsISBN:9781319042578Author:David S. Moore, William I. Notz, Michael A. FlignerPublisher:W. H. Freeman
 Introduction to the Practice of StatisticsStatisticsISBN:9781319013387Author:David S. Moore, George P. McCabe, Bruce A. CraigPublisher:W. H. Freeman
MATLAB: An Introduction with Applications
Statistics
ISBN:9781119256830
Author:Amos Gilat
Publisher:John Wiley & Sons Inc
Probability and Statistics for Engineering and th...
Statistics
ISBN:9781305251809
Author:Jay L. Devore
Publisher:Cengage Learning
Statistics for The Behavioral Sciences (MindTap C...
Statistics
ISBN:9781305504912
Author:Frederick J Gravetter, Larry B. Wallnau
Publisher:Cengage Learning
Elementary Statistics: Picturing the World (7th E...
Statistics
ISBN:9780134683416
Author:Ron Larson, Betsy Farber
Publisher:PEARSON
The Basic Practice of Statistics
Statistics
ISBN:9781319042578
Author:David S. Moore, William I. Notz, Michael A. Fligner
Publisher:W. H. Freeman
Introduction to the Practice of Statistics
Statistics
ISBN:9781319013387
Author:David S. Moore, George P. McCabe, Bruce A. Craig
Publisher:W. H. Freeman