
Human Anatomy & Physiology (11th Edition)
11th Edition
ISBN: 9780134580999
Author: Elaine N. Marieb, Katja N. Hoehn
Publisher: PEARSON
expand_more
expand_more
format_list_bulleted
Related questions
Concept explainers
Question

Transcribed Image Text:### Evolution of Anole Species
#### Question
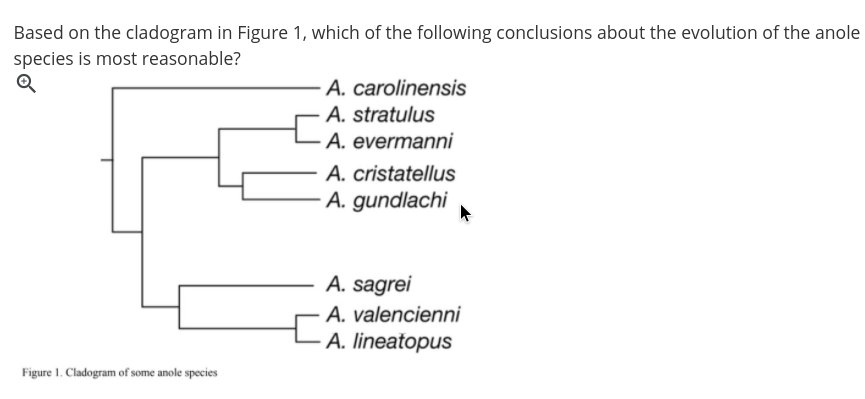
Based on the cladogram in Figure 1, which of the following conclusions about the evolution of the anole species is most reasonable?
#### Cladogram Description
Figure 1 depicts a cladogram of some anole species. A cladogram is a diagram used to show relations among organisms. It is a type of phylogenetic tree that does not represent the amount of evolutionary change.
The cladogram in Figure 1 lists the following anole species:
1. **A. carolinensis**
2. **A. stratulus**
3. **A. evermanni**
4. **A. cristatellus**
5. **A. gundlachi**
6. **A. sagrei**
7. **A. valencienni**
8. **A. lineatopus**
The branching pattern indicates evolutionary relationships among these species. Here is a detailed breakdown of the connections:
- **A. carolinensis** and **A. stratulus** share a common ancestor, as do **A. evermanni**, **A. cristatellus**, and **A. gundlachi** within a slightly larger group.
- **A. sagrei** shares a more distant common ancestor with this entire group.
- **A. valencienni** and **A. lineatopus** share a common ancestor with each other but are more distantly related to the other groups.
This structure helps infer which species share recent common ancestors and provides a hypothesis for the sequence of branching events in the evolutionary history of these anole species.
**Figure 1: Cladogram of some anole species.**

Transcribed Image Text:**Evolutionary Pathways of Species**
This question explores the different mechanisms through which species can evolve. There are four provided choices, each representing a distinct evolutionary pathway. The selected choice is marked with a blue checkmark.
1. **Convergent Evolution in Different Locations:**
- Each species evolved in a different location, and all underwent convergent evolution.
2. **Genetic Bottleneck Impact:**
- Each species evolved as a result of a genetic bottleneck.
3. **Random Mutations from a Common Ancestor: (Selected Choice)**
- Each species evolved by inheriting random mutations from the common ancestor.
4. **Different Selective Pressures:**
- Each species evolved as a result of different selective pressures.
**Explanation of Selected Choice:**
- The correct answer, indicated by the blue checkmark, is "Each species evolved by inheriting random mutations from the common ancestor." This implies that the species shared a common ancestor and diverged over time due to random genetic mutations. This is a foundational concept in evolutionary biology, illustrating how genetic variation contributes to the diversity of life forms observed today.
Expert Solution
This question has been solved!
Explore an expertly crafted, step-by-step solution for a thorough understanding of key concepts.

This is a popular solution

Trending nowThis is a popular solution!

Step by stepSolved in 2 steps

Knowledge Booster


Learn more about
Need a deep-dive on the concept behind this application? Look no further. Learn more about this topic, biology and related others by exploring similar questions and additional content below.Similar questions
- For the first phylogenetic tree, if we assume absolute time is NOT represented, can we say that the species in circle B are more closely related than the species in Circle A? For the second phylogenetic tree (if we hold the same assumptions), can we say that B and C are more closely related than A and C?arrow_forwardWhen constructing phylogenetic trees, what is the purpose of applying maximum parsimony? Parsimony allows the researcher to "root" the tree. For trees based on morphology, the most parsimonious tree requires the maximum evolutionary events. The outgroup roots the tree, allowing the principle of parsimony to be applied. For trees based on morphology, the most parsimonious is the one that uses the simplest explanation of evolutionary events.arrow_forwardConsider the following sample dataset of character traits for five taxa (A, B, C, D, and E) and an outgroup (O) and answer the following: Taxon, Character 1 A B C D 1 1 1 0 0 Character 2 0 0 0 1 1 0 Character 3 1 1 0 0 0 0 Character 4 1 1 1 0 0 0 (A) Identify which character traits are ancestral and which are derived, (B) Determine the two taxa most closely related to each other (C) Are any of the character traits obvious homoplasies? If so, which ones? (D) Name three taxa that if put in their own taxonomic group would be considered paraphyletic.arrow_forward
- Sketch the generated phylogenetic tree below and color the branches of the generated phylogenetic tree according the the island: 1) Anolis sheplani 2) Anolis cybotes 3) Anolis olssoni 4) Anolis celestinus 5) Anolis occultus 6) Anolis cristatellus 7) Anolis puchellus 8) Anolis evermanni Hispaniola Species - Blue Puerto Rico Species - Red 1) What can you conclude about the relatedness of anole lizards living on these two islands?arrow_forwardSuppose we are sure, because of previous studies, that species 1, 2, and 3 are more closely related to each other than to species 4 (outgroup). We sequence a gene and find ten nucleotide sites that differ among the four species. Draw the most parsimonious tree and label each evolutionary change on the tree (Position – new nucleotide; Example = 8T or 6C). *The answer is below but I do not understand where the numbers or tick marks came from? Could someone explain. For example, why is the 1A on the 2?arrow_forwardSpecies A and B have long wings, whereas species C has short wings. Which of the following pieces of evidence would best support the hypothesis that long wings are a synapomorphy? A. DNA evidence showing that species B and C are sister species B. Fossil evidence showing that the common ancestor of species A, B, and C had short wings C. DNA evidence showing that species A and C are sister species D. Fossil evidence showing that the common ancestor of species A, B, and C had long wings E. Evidence showing that species A and B live in an environment that favors long wings, whereas species C lives in an environment that favors short wingsarrow_forward
- The diagram below represents the ranges of 3 species (A, B, and C), which are separated by a mountain range and river. It has been hypothesized that these three species arose via vicariance ecological speciation. Specifically, the entire area was originally occupied by a single species. Its range was split first by the mountain range. Later, the river formed, separating populations on the eastern side of the mountains. If this hypothesis is correct, phylogenetic analysis should reveal that: NIS 4 44444 U LEL B All three species are equally related to each other. Species A and B are each other's closest relatives (sister taxa). Species B and C are each other's closest relatives (sister taxa). Species A and Care each other's closest relatives (sister taxa).arrow_forwardTo test evolutionary hypotheses, you make a phylogeny of a group of organisms based on six traits: A B 1 2 E 5 2 1= singing 2= nest-building 3 = short legs 4 = hollow snout 5= crest J L M 6 = tree dwelling a) Based on your phylogeny, did hollow snouts evolve to allow singing? Explain your answer. b) Your friend wants to put all of the species that have hollow snouts into a single taxonomic group. Is this a good taxonomic group? Explain your answer. 4.arrow_forward4 05 4 3. 2. D.arrow_forward
arrow_back_ios
arrow_forward_ios
Recommended textbooks for you
- Human Anatomy & Physiology (11th Edition)BiologyISBN:9780134580999Author:Elaine N. Marieb, Katja N. HoehnPublisher:PEARSON
 Biology 2eBiologyISBN:9781947172517Author:Matthew Douglas, Jung Choi, Mary Ann ClarkPublisher:OpenStax
 Anatomy & PhysiologyBiologyISBN:9781259398629Author:McKinley, Michael P., O'loughlin, Valerie Dean, Bidle, Theresa StouterPublisher:Mcgraw Hill Education,
  Molecular Biology of the Cell (Sixth Edition)BiologyISBN:9780815344322Author:Bruce Alberts, Alexander D. Johnson, Julian Lewis, David Morgan, Martin Raff, Keith Roberts, Peter WalterPublisher:W. W. Norton & Company
 Laboratory Manual For Human Anatomy & PhysiologyBiologyISBN:9781260159363Author:Martin, Terry R., Prentice-craver, CynthiaPublisher:McGraw-Hill Publishing Co.
 Inquiry Into Life (16th Edition)BiologyISBN:9781260231700Author:Sylvia S. Mader, Michael WindelspechtPublisher:McGraw Hill Education
Human Anatomy & Physiology (11th Edition)
Biology
ISBN:9780134580999
Author:Elaine N. Marieb, Katja N. Hoehn
Publisher:PEARSON
Biology 2e
Biology
ISBN:9781947172517
Author:Matthew Douglas, Jung Choi, Mary Ann Clark
Publisher:OpenStax
Anatomy & Physiology
Biology
ISBN:9781259398629
Author:McKinley, Michael P., O'loughlin, Valerie Dean, Bidle, Theresa Stouter
Publisher:Mcgraw Hill Education,
Molecular Biology of the Cell (Sixth Edition)
Biology
ISBN:9780815344322
Author:Bruce Alberts, Alexander D. Johnson, Julian Lewis, David Morgan, Martin Raff, Keith Roberts, Peter Walter
Publisher:W. W. Norton & Company
Laboratory Manual For Human Anatomy & Physiology
Biology
ISBN:9781260159363
Author:Martin, Terry R., Prentice-craver, Cynthia
Publisher:McGraw-Hill Publishing Co.
Inquiry Into Life (16th Edition)
Biology
ISBN:9781260231700
Author:Sylvia S. Mader, Michael Windelspecht
Publisher:McGraw Hill Education