MATLAB: An Introduction with Applications
6th Edition
ISBN: 9781119256830
Author: Amos Gilat
Publisher: John Wiley & Sons Inc
expand_more
expand_more
format_list_bulleted
Question
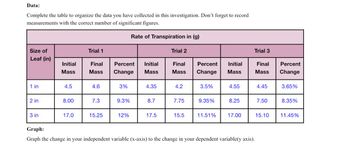
Based on a science expiremtn following the data table down below. Create a
Graph the change in your independent variable (x-axis) to the change in your dependent variable(y axis).

Transcribed Image Text:**Data:**
Complete the table to organize the data you have collected in this investigation. Don't forget to record measurements with the correct number of significant figures.
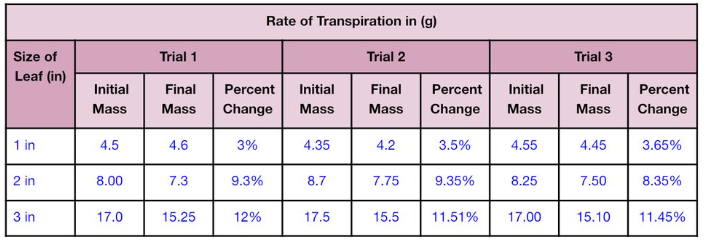
| Size of Leaf (in) | Trial 1 | Trial 2 | Trial 3 |
|------------------|----------------------------------|----------------------------------|----------------------------------|
| | Initial Mass | Final Mass | Percent Change | Initial Mass | Final Mass | Percent Change | Initial Mass | Final Mass | Percent Change |
| 1 in | 4.5 | 4.6 | 3% | 4.35 | 4.2 | 3.5% | 4.55 | 4.45 | 3.65% |
| 2 in | 8.00 | 7.3 | 9.3% | 8.7 | 7.75 | 9.35% | 8.25 | 7.50 | 8.35% |
| 3 in | 17.0 | 15.25 | 12% | 17.5 | 15.5 | 11.51% | 17.00 | 15.10 | 11.45% |
**Graph:**
Graph the change in your independent variable (x-axis) to the change in your dependent variable (y-axis).
Expert Solution
arrow_forward
Step 1: Write the given information
Given the data as

Step by stepSolved in 3 steps with 3 images

Knowledge Booster
Similar questions
- The following data was collected to explore how the number of square feet in a house, the number of bedrooms, and the age of the house affect the selling price of the house. The dependent variable is the selling price of the house, the first independent variable (x1x1) is the square footage, the second independent variable (x2x2) is the number of bedrooms, and the third independent variable (x3x3) is the age of the house. Effects on Selling Price of Houses Square Feet Number of Bedrooms Age Selling Price 24332433 3 22 277600277600 20602060 4 99 250900250900 19121912 3 99 114800114800 24782478 3 55 290000290000 18841884 4 1414 287300287300 25982598 3 1313 123700123700 30743074 4 22 193900193900 27382738 3 88 146900146900 13981398 5 55 272200272200 Step 1 of 2: Find the p-value for the regression equation that fits the given data. Round your answer to four decimal places. Step 2 of 2: Determine if a statistically significant linear relationship exists…arrow_forwardPart a through e please. Thank you!arrow_forwardwrite and equation that gives the number of tickets sold y as linear function of number of hours x since the tickets have been on salearrow_forward
- The equation y=-2x is an example of: (check all that apply) negative correlation Positive relationship Curvilinear relationship. A straight line Inverse Relationship.arrow_forwardThe following data was collected to explore how the number of square feet in a house, the number of bedrooms, and the age of the house affect the selling price of the house. The dependent variable is the selling price of the house, the first independent variable (x1x1) is the square footage, the second independent variable (x2x2) is the number of bedrooms, and the third independent variable (x3x3) is the age of the house. Effects on Selling Price of Houses Square Feet Number of Bedrooms Age Selling Price 2823 5 1313 297100 2659 4 1313 281600 2589 3 1111 277300 2539 3 1010 276300 1954 3 55 224300 1927 3 44 215000 1785 3 33 172700 1627 2 22 172000 1133 2 22 111700 Step 1 of 2 : Find the p-value for the regression equation that fits the given data == what is the p-value for the regression equation?arrow_forwardMiayear Assessment Samantha purchased a package of sugar cookles. The nutrition label states that each serving size of cookles contains 160 calorles. Samantha creates the graph below showing the number of cookies eaten and the number of calorles consumed. 960- 800- 640 480- 320- 160- 6 10 12 14 16 Cookies Eaten Part A: Write an equation that represents the data graphed by Samantha. Sign out US O 田 Calories Consumedarrow_forward
- L3Q2.Describe the variables in the given table using a TI calculator. x y 15 12 20 22 17 -3 A.Moderate and positive B.Weak and positive C.Weak and negative D.No correlationarrow_forwardWhich phase in a forensic investigation is likely to be most relevant to Excel? Data analysis Data entry Data preparation Data collectionarrow_forwardWrite an equation of a line in slope-intercept form for a line that passes through (0, 5) and has a slope of 1.5arrow_forward
- Below is a scatterplot of a student’s SAT score and their college GPA. Suppose we want to decide if a student’s SAT score and their GPA are linearly related. What does this scatterplot tell us of the relationship? Support your answer. SAT score_GPA scatterplot.pdfarrow_forwardA car dealership is analyzing the changes in its monthly sales. They sold 40 cars in March, 55 in April, 61 in May, 29 in June, 63 in July, and 40 in August. Create line graph that represents this data. 3.arrow_forwardInterpret the slope in contextarrow_forward
arrow_back_ios
SEE MORE QUESTIONS
arrow_forward_ios
Recommended textbooks for you
 MATLAB: An Introduction with ApplicationsStatisticsISBN:9781119256830Author:Amos GilatPublisher:John Wiley & Sons Inc
 Probability and Statistics for Engineering and th...StatisticsISBN:9781305251809Author:Jay L. DevorePublisher:Cengage Learning
 Statistics for The Behavioral Sciences (MindTap C...StatisticsISBN:9781305504912Author:Frederick J Gravetter, Larry B. WallnauPublisher:Cengage Learning
 Elementary Statistics: Picturing the World (7th E...StatisticsISBN:9780134683416Author:Ron Larson, Betsy FarberPublisher:PEARSON
 The Basic Practice of StatisticsStatisticsISBN:9781319042578Author:David S. Moore, William I. Notz, Michael A. FlignerPublisher:W. H. Freeman
 Introduction to the Practice of StatisticsStatisticsISBN:9781319013387Author:David S. Moore, George P. McCabe, Bruce A. CraigPublisher:W. H. Freeman

MATLAB: An Introduction with Applications
Statistics
ISBN:9781119256830
Author:Amos Gilat
Publisher:John Wiley & Sons Inc

Probability and Statistics for Engineering and th...
Statistics
ISBN:9781305251809
Author:Jay L. Devore
Publisher:Cengage Learning

Statistics for The Behavioral Sciences (MindTap C...
Statistics
ISBN:9781305504912
Author:Frederick J Gravetter, Larry B. Wallnau
Publisher:Cengage Learning

Elementary Statistics: Picturing the World (7th E...
Statistics
ISBN:9780134683416
Author:Ron Larson, Betsy Farber
Publisher:PEARSON

The Basic Practice of Statistics
Statistics
ISBN:9781319042578
Author:David S. Moore, William I. Notz, Michael A. Fligner
Publisher:W. H. Freeman

Introduction to the Practice of Statistics
Statistics
ISBN:9781319013387
Author:David S. Moore, George P. McCabe, Bruce A. Craig
Publisher:W. H. Freeman