
MATLAB: An Introduction with Applications
6th Edition
ISBN: 9781119256830
Author: Amos Gilat
Publisher: John Wiley & Sons Inc
expand_more
expand_more
format_list_bulleted
Related questions
Question
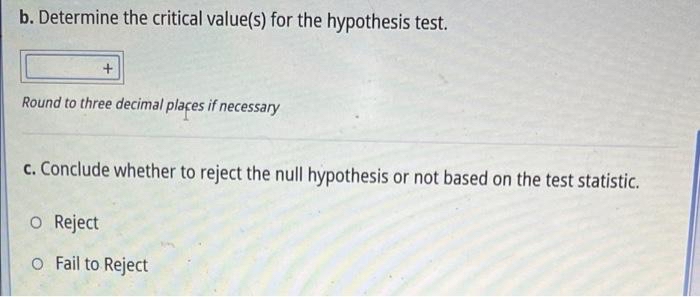

Transcribed Image Text:b. Determine the critical value(s) for the hypothesis test.
Round to three decimal plaçes if necessary
c. Conclude whether to reject the null hypothesis or not based on the test statistic.
o Reject
o Fail to Reject

Transcribed Image Text:A random sample of n = 18 securities in Economy A produced mean returns of
X1 = 5.5% with s = 2.3% while another random sample of n2 = 19 securities in
Economy B produced mean returns of x2 = 4.8% with s2 2.5%. At a = 0.01, can
we infer that the returns differ significantly between the two economies?
%3D
%3D
%3D
Assume that the samples are independent and randomly selected from normal
populations with equal population variances (o1? = 02²).
T-Distribution Table
a. Calculate the test statistic.
t =
0.000
Round to three decimal places if necessary
Expert Solution
This question has been solved!
Explore an expertly crafted, step-by-step solution for a thorough understanding of key concepts.

Step by stepSolved in 2 steps with 2 images

Knowledge Booster

Similar questions
- Use technology to find the P-value for the hypothesis test described below. The claim is that for 12 AM body temperatures, the mean is mu greater than 98.6 degrees F. The sample size is n equals 8 and the test statistic is t equals 1.349. P-value equals (Round to three decimal places as needed.)arrow_forwardB. Identify the test statistic test C. Identify the P-value for this hypothesis test D. If P-value is reject H0 or fail to reject H0?arrow_forwardrepresents the summary statistics for 44 blue catfish caught at this reservoir, and a 0.05 significance level to test the claim that the mean weight of the fish in the John H. Kerr Reservoir is greater than 40 pounds. n = 44; = 40.76 pounds; s = 5.12 pounds a) kdentify the null and alternative hypotheses? Ho: =V 40 H.:p>v40 b) What type of hypothesis test should you conduct (left-, right-, or two-tailed)? O left-tailed O right-tailed O two-tailed c) Identify the appropriate significance level. 0.05 d) Calculate your test statistic. (Round your final answer to two decimal places.) e) Calculate your p-value. (Round your final answer to four decimal places.) f) Do you reject the null hypothesis? O We reject the null hypothesis, since the p-value is less than the significance level. O We reject the null hypothesis, since the p-value is not less than the significance level. O We do not reject the null hypothesis, since the p-value is less than the significance level. O We do not reject the…arrow_forward
- In each part, we have given the significance level and the P-value for a hypothesis test. For each case determine if the null hypothesis should be rejected. Write "reject" or "do not reject" (without quotations). Double check that you have'typed your answers correctly (no spelling errors) BEFORE you submit. In order to allow you more than one attempt at this problem, the problem will not tell you which part(s) are correct if you do not get all parts correct. (a) a = 0.01, P= 0.06 answer (b) a 0.06, P = 0.06 answer. (C) a = 0.07, P = 0.06 answer.arrow_forwardA researcher believes that more than half of college students average less than 6 hours of sleep per night during the week. Suppose she collected data to test her belief and found a p-value < 0.0001. Fill in the information for her hypothesis test below. Type of test: a. Left-tail b. Right-tail c. Two-tailarrow_forwardLillie conducts a hypothesis test and calculates that her sample results have a p-value of 0043, what decision can be made about the null hypothesis? O fail to reject the null O Reject the nullarrow_forward
- A dentist wondered if his appointments were distributed evenly from Monday to Friday each week. He took a random sample of 500 appointments and recorded which day of the week they were booked for. His results are: Day Appointment Frequency Monday Search 104 Chi Square Distribution Table MA Tuesday 118 Wednesday 119 Thursday 2 The dentist would like to use these results to conduct a x² goodness-of-fit test to determine if the distribution of appointments agrees with an even distribution using a 0.5% level of significance. SUBMIT QUESTION 94 Friday SAVE PROGRESS 65 SUBMITarrow_forwardUse technology to find the P-value for the hypothesis test described below. The claim is that for 12 AM body temperatures, the mean is mu greater than 98.6 degrees F. The sample size is n equals 5 and the test statistic is t equals 1.486. P-value equals (Round to three decimal places as needed.)arrow_forwardThe Pavalue for a hypothesis test is shown. Use the P-value to decide whether to reject Ho when the level of significance is (a) a = 0.01, (b) a = 0.05. and (c)g=0 10 P=0.0816 (a) Do you reject or fail to reject Ho at the 0.01 level of significance? O A. Fail to reject Ho because the P-value, 0.0816, is less than a = 0.01. O B. Fail to reject H, because the P-value, 0.0816, is greater than a= 0.01. OC. Reject H, because the P-value, 0.0816, is less than a=0.01. O D. Reject Ho because the P-value, 0.0816, is greater thana= 0.01. (b) Do you reject or fail to reject H, at the 0.05 level of significance? O A. Reject Ho because the P-value, 0.0816, is less than a =0.05. O B. Fail to reject H, because the P-value, 0.0816, is greater than a= 0.05. OC. Reject H, because the P-value, 0.0816, is greater than oa 0.05. O D. Fail to reject Ho because the P-value, 0.0816, is less than a = 0,05. (c) Do you reject or fail to reject Ho at the 0.10 level of significance? O A. Reject Ho because the…arrow_forward
- A null and alternative hypothesis are given. Determine whether the hypothesis test is left-tailed, right-tailed, or two-tailed. Họ: o 2 2.8 Ha: o < 2.8 What type of test is being conducted in this problem? O A. Two-tailed test B. Left-tailed test OC. Right-tailed testarrow_forwardConsider a drug testing company that provides a test for marijuana usage. Among 335 tested subjects, results from 27 subjects were wrong (either a false positive or a false negative). Use a 0.05 significance level to test the claim that less than 10 percent of the test results are wrong. Identify the null and alternative hypotheses for this test. Choose the correct answer below. O A. Ho: p=0.1 H1:p0.1 OC. Ho: p<0.1 H1:p=0.1 O D. Ho: p=0.1 H1:p+0.1arrow_forwardIdentify the claim and state Ho and H Determine whether the hypothesis test is left-tailed, right-tailed, or two-tailed, and whether to use a z-test, a t-test, or a chi-square test. Explain your reasoning. Find the critical value(s), identify the rejection region(s), and find the appropriate standardized test statistic. Decide whether to reject or fail to reject the null hypothesis. Interpret the decision in the context of the original claim. A government agency reports that the mean amount of earnings for full-time workers ages 25 to 34 with a master’s degree is less than $70,000. In a random sample of 15 full-time workers ages 25 to 34 with a master’s degree, the mean amount of earnings is $66,231 and the standard deviation is $5945. At α = 0.05, is there enough evidence to support the agency’s claim? Assume the population is normally distributed.arrow_forward
arrow_back_ios
arrow_forward_ios
Recommended textbooks for you
- MATLAB: An Introduction with ApplicationsStatisticsISBN:9781119256830Author:Amos GilatPublisher:John Wiley & Sons Inc
 Probability and Statistics for Engineering and th...StatisticsISBN:9781305251809Author:Jay L. DevorePublisher:Cengage Learning
 Statistics for The Behavioral Sciences (MindTap C...StatisticsISBN:9781305504912Author:Frederick J Gravetter, Larry B. WallnauPublisher:Cengage Learning
  Elementary Statistics: Picturing the World (7th E...StatisticsISBN:9780134683416Author:Ron Larson, Betsy FarberPublisher:PEARSON
 The Basic Practice of StatisticsStatisticsISBN:9781319042578Author:David S. Moore, William I. Notz, Michael A. FlignerPublisher:W. H. Freeman
 Introduction to the Practice of StatisticsStatisticsISBN:9781319013387Author:David S. Moore, George P. McCabe, Bruce A. CraigPublisher:W. H. Freeman
MATLAB: An Introduction with Applications
Statistics
ISBN:9781119256830
Author:Amos Gilat
Publisher:John Wiley & Sons Inc
Probability and Statistics for Engineering and th...
Statistics
ISBN:9781305251809
Author:Jay L. Devore
Publisher:Cengage Learning
Statistics for The Behavioral Sciences (MindTap C...
Statistics
ISBN:9781305504912
Author:Frederick J Gravetter, Larry B. Wallnau
Publisher:Cengage Learning
Elementary Statistics: Picturing the World (7th E...
Statistics
ISBN:9780134683416
Author:Ron Larson, Betsy Farber
Publisher:PEARSON
The Basic Practice of Statistics
Statistics
ISBN:9781319042578
Author:David S. Moore, William I. Notz, Michael A. Fligner
Publisher:W. H. Freeman
Introduction to the Practice of Statistics
Statistics
ISBN:9781319013387
Author:David S. Moore, George P. McCabe, Bruce A. Craig
Publisher:W. H. Freeman