
MATLAB: An Introduction with Applications
6th Edition
ISBN: 9781119256830
Author: Amos Gilat
Publisher: John Wiley & Sons Inc
expand_more
expand_more
format_list_bulleted
Related questions
Question
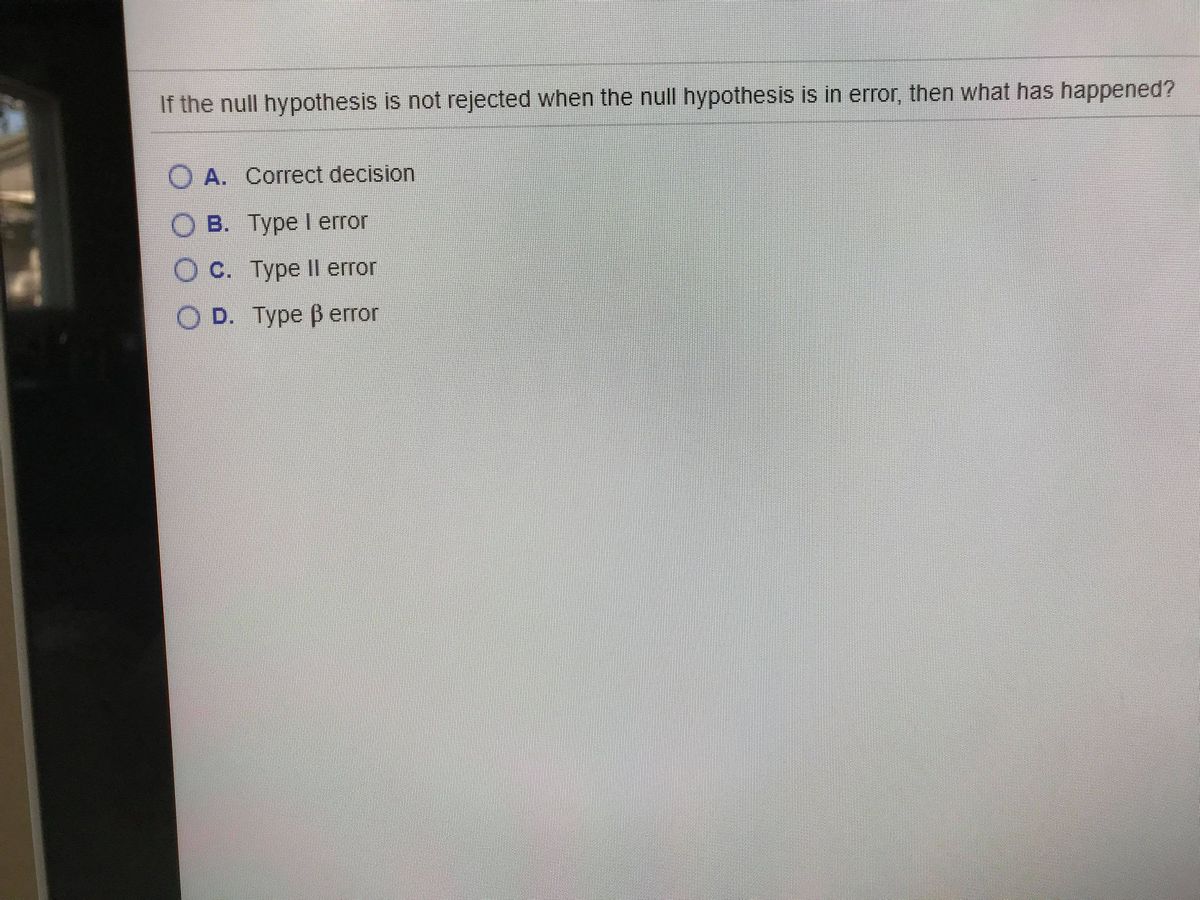

Transcribed Image Text:If the null hypothesis is not rejected when the null hypothesis is in error, then what has happened?
O A. Correct decision
O B. Type I error
OC. Type Il error
O D. Type B error
Expert Solution
This question has been solved!
Explore an expertly crafted, step-by-step solution for a thorough understanding of key concepts.

This is a popular solution

Trending nowThis is a popular solution!

Step by stepSolved in 2 steps

Knowledge Booster


Learn more about
Need a deep-dive on the concept behind this application? Look no further. Learn more about this topic, statistics and related others by exploring similar questions and additional content below.Similar questions
- The variable of interest in an investigation is the score obtained by two populations of final-year students from a mathematics achievement test.The researchers assume that the scores of the two populations were normally distributed with means μ1=50, μ2=40 and variances σ21=25, σ22=49 a random sample of 10 students. selects from the first population and another independently the first of 12 students from the second population a) What is the probability that the difference between the sample means 1 minus 2 is between 5 and 15 points? b) What must be the minimum size of the samples so that less than 5% of the average of the students in sample 1 has a maximum advantage of 7 points over the average of the students in sample 2?arrow_forwardClassify the conclusion of the hypothesis test as a Type I error, a Type Il error, or a correct decision. In 1993, the average math SAT score for students at one school was 471. Five years later, a teacher wants to perform a hypothesis test to determine whether the average math SAT H,:µ=D471 score of students at the school has changed from the 1993 mean of 471. The hypotheses are: H, :µ ± 471 Suppose that the results of the sampling lead to rejection of the null hypothesis. Classify that conclusion as a Type I error, a Type Il error, or a correct decision, if in fact the average math SAT score of students at the school has changed from the 1993 mean of 471. Турe I error О Турe II error O Correct decisionarrow_forward64) If z is a standard normal variable, find the probability that z lies between -2.41 and 0.A) 0.4920 B) 0.4910 C) 0.5080 D) 0.0948arrow_forward
- Use RCommander for code and output Define the parameter, the hypothesis, a, and compute the value of the test statistic, p-value, and state the decision and conclusion Childhood lead poisoning is a public health concern in the United States. In a certain population, 1 child in 8 has a high blood lead level (defined as 30 µg/dl or more). In a randomly chosen group of 16 children from this population, determine the following. 1. a) More than 2 but less than 6 children have high blood lead? 1. b) How many of the 16 children are expected to have high blood lead? 1. c) At least 1 child has high blood lead? 1. d) What number of children have high blood lead to reach the 80th percentile? 1. e) Exactly 2 children have high blood lead?arrow_forwardPlease have final answer as one or zero.arrow_forwardOThe test statistic in a two- tailed test is z = - 1.63. A) 0.1032; fail to reject the null hypothesis C) 0.0516; fail to reject the null hypothesis B) 0.9484; fail to reject the null hypothesis D) 0.0516; reject the null hypothesisarrow_forward
- Express the null hypothesis and the alternative hypothesis in symbolic form for a test to support this claim. Use the correct symbol (µ,p, o) for the indicated parameter. An entomologist writes an article in a scientific journal which claims that fewer than 16 in ten thousand male fireflies are unable to produce light due to a genetic mutation. Use the parameter p, the true proportion of fireflies unable to produce light. О Но: р 0.0016 H1: ps0.0016 O Ho: p = 0.0016 H1: p > 0.0016 %3Darrow_forwardThe mean SAT score in mathematics, µ, is 539. The standard deviation of these scores is 39. A special preparation course claims that its graduates will score higher, on average, than the mean score 539. A random sample of 80 students completed the course, and their mean SAT score in mathematics was 544. At the 0.05 level of significance, can we conclude that the preparation course does what it claims? Assume that the standard deviation of the scores of course graduates is also 39. 圖 Perform a one-tailed test. Then fill in the table below. Carry your intermediate computations to at least three decimal places, and round your responses as specified in the table. (If necessary, consult a list of formulas.)arrow_forwardz-03/16/2021 16:29 00:21:10 The dot plots show a random selection of commute times in two cities. City A City B + 0 5 10 15 20 25 30 35 40 45 50 55 60 Commute Time (in minutes) 11 Which is a valid inference based on the data? The commute times are shorter and more predictable for City A. The commute times are shorter and more predictable for City B. The commute times are shorter for City A but more predictable for City B. The commute times are shorter for City B but more predictable for City A.arrow_forward
- 9) A hypothesis test is to be conducted using the claim that the mean hourly wage of employess in a large company is at least $21. What are the null and alternative hypothesis? pick one a H 0 : 21 vs H a : < 21 b H 0 : μ ≤ 21 vs H a : μ > 21 c H 0 : μ 21 vs H a : μ < 21 d H 0 : p 21 vs H a : p < 2arrow_forwardperform two non-parametric tests. For each hypothesis test make sure to report the following steps: Identify why you choose to perform the statistical test (Sign test, Wilcoxon test, Kruskal-Wallis test). Identify the null hypothesis, Ho, and the alternative hypothesis, Ha. Determine whether the hypothesis test is left-tailed, right-tailed, or two-tailed. Find the critical value(s) and identify the rejection region(s). Find the appropriate standardized test statistic. If convenient, use technology. Decide whether to reject or fail to reject the null hypothesis. Interpret the decision in the context of the original claim. 1) A convenience store owner believes that the median number of lottery tickets sold per day is 44. A random sample of 20 days yields the data below. Performa Sign test to test the owner's claim.Use α = 0.05. 27 43 54 59 26 50 65 22 28 3342 49 49 39 39 44 44 54…arrow_forwardfind the p-value for the hypothesis test with the standard test statistic z. decide whether to reject H0 for the level of significanceα 14. Left-tailed test (z=-1.55, α=0.05) 16. Right-tailed test (z=1.23, α=0.10) 18. Two-tailed test (z=1.95, α=0.08)arrow_forward
arrow_back_ios
SEE MORE QUESTIONS
arrow_forward_ios
Recommended textbooks for you
- MATLAB: An Introduction with ApplicationsStatisticsISBN:9781119256830Author:Amos GilatPublisher:John Wiley & Sons Inc
 Probability and Statistics for Engineering and th...StatisticsISBN:9781305251809Author:Jay L. DevorePublisher:Cengage Learning
 Statistics for The Behavioral Sciences (MindTap C...StatisticsISBN:9781305504912Author:Frederick J Gravetter, Larry B. WallnauPublisher:Cengage Learning
  Elementary Statistics: Picturing the World (7th E...StatisticsISBN:9780134683416Author:Ron Larson, Betsy FarberPublisher:PEARSON
 The Basic Practice of StatisticsStatisticsISBN:9781319042578Author:David S. Moore, William I. Notz, Michael A. FlignerPublisher:W. H. Freeman
 Introduction to the Practice of StatisticsStatisticsISBN:9781319013387Author:David S. Moore, George P. McCabe, Bruce A. CraigPublisher:W. H. Freeman
MATLAB: An Introduction with Applications
Statistics
ISBN:9781119256830
Author:Amos Gilat
Publisher:John Wiley & Sons Inc
Probability and Statistics for Engineering and th...
Statistics
ISBN:9781305251809
Author:Jay L. Devore
Publisher:Cengage Learning
Statistics for The Behavioral Sciences (MindTap C...
Statistics
ISBN:9781305504912
Author:Frederick J Gravetter, Larry B. Wallnau
Publisher:Cengage Learning
Elementary Statistics: Picturing the World (7th E...
Statistics
ISBN:9780134683416
Author:Ron Larson, Betsy Farber
Publisher:PEARSON
The Basic Practice of Statistics
Statistics
ISBN:9781319042578
Author:David S. Moore, William I. Notz, Michael A. Fligner
Publisher:W. H. Freeman
Introduction to the Practice of Statistics
Statistics
ISBN:9781319013387
Author:David S. Moore, George P. McCabe, Bruce A. Craig
Publisher:W. H. Freeman