MATLAB: An Introduction with Applications
6th Edition
ISBN: 9781119256830
Author: Amos Gilat
Publisher: John Wiley & Sons Inc
expand_more
expand_more
format_list_bulleted
Question
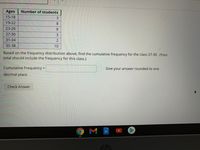
Based on the frequency distribution above, find the cumulative frequency for class 27-30. (Your total should include the frequency for this class.)
Cumulative Frequency =
Give your answer rounded to one decimal place

Transcribed Image Text:Ages
Number of students
15-18
3
19-22
8.
23-26
8
27-30
3
31-34
2
35-38
10
Based on the frequency distribution above, find the cumulative frequency for the class 27-30. (Your
total should include the frequency for this class.)
Cumulative Frequency =
Give your answer rounded to one
decimal place
Check Answer
Expert Solution
This question has been solved!
Explore an expertly crafted, step-by-step solution for a thorough understanding of key concepts.
This is a popular solution
Trending nowThis is a popular solution!
Step by stepSolved in 2 steps

Knowledge Booster
Learn more about
Need a deep-dive on the concept behind this application? Look no further. Learn more about this topic, statistics and related others by exploring similar questions and additional content below.Similar questions
- Can you please answer this ASAP? Thank you so mucharrow_forwardFind the 5 number summary for the data shown. 16 18 37 58 76 14 35 50 67 86 5 number summary: 1 12 86arrow_forward50 part-time students were asked how many courses they were taking this term. The (incomplete) results are shown below: # of Courses Frequency Relative Frequency Cumulative Frequency 1 14 0.28 2 18 3 a. Complete the table. b. What percent of students take exactly three courses? %arrow_forward
- Asaparrow_forwardFind the measure Of the missingangarrow_forward50 part-time students were asked how many courses they were taking this term. The (incomplete) results are shown below: # of Courses Frequency Relative Frequency Cumulative Frequency 1 14 0.28 2 17 3 a. Complete the table.b. What percent of students take exactly two courses? %arrow_forward
- Suppose you go to the grocery store and spend $92.54 for the purchase of 12 items . What is the mean price per item round 2 decimal placesarrow_forwardplease complete the blank problem and or ones with a red x next to it not ones with a green check next to pleasearrow_forwardThe table gives the average monthly high and low temperatures, in degrees Fahrenheit, for a particular city over the course of a year. Find the mean and median of the low temperatures. Click here to view the monthly high and low temperatures. Monthly high and low temperatures The mean low temperature is 49.8 °F. (Type an integer or decimal rounded to the nearest tenth as needed.) Month High Low The median low temperature is°F. (Type an integer or decimal rounded to the nearest tenth as needed.) January 48 30 February 52 33 March 60 40 April 47 May 77 57 June 85 64 July 88 69 August 86 69 September 79 63 October 69 50 November 61 41arrow_forward
- Give an example of a set of 10 numbers for the following: an average equal to the median.arrow_forwardA local, family-owned restaurant also gathered data for two weeks of orders. The following set of data represents the number of orders filled by this restaurant during a two week period. Construct a five number summary for the the data. 82, 81, 65, 62, 86, 81, 83, 62, 81, 81, 68, 71, 85, 62, 87 (Round to the nearest hundredth, if needed). Min _______________________ Lower Quartile _______________________ Median ________________________ Upper Quartile _________________________ Maximum __________________________ What is the range and interquartile range for the family-owned restaurant? Range ___________________________ Interquartile Range ____________________________ Considering this data only, did the national-chain restaurant or the family-owned restaurant do better for the past two weeks? _______________________________________arrow_forwardhelparrow_forward
arrow_back_ios
SEE MORE QUESTIONS
arrow_forward_ios
Recommended textbooks for you
 MATLAB: An Introduction with ApplicationsStatisticsISBN:9781119256830Author:Amos GilatPublisher:John Wiley & Sons Inc
 Probability and Statistics for Engineering and th...StatisticsISBN:9781305251809Author:Jay L. DevorePublisher:Cengage Learning
 Statistics for The Behavioral Sciences (MindTap C...StatisticsISBN:9781305504912Author:Frederick J Gravetter, Larry B. WallnauPublisher:Cengage Learning
 Elementary Statistics: Picturing the World (7th E...StatisticsISBN:9780134683416Author:Ron Larson, Betsy FarberPublisher:PEARSON
 The Basic Practice of StatisticsStatisticsISBN:9781319042578Author:David S. Moore, William I. Notz, Michael A. FlignerPublisher:W. H. Freeman
 Introduction to the Practice of StatisticsStatisticsISBN:9781319013387Author:David S. Moore, George P. McCabe, Bruce A. CraigPublisher:W. H. Freeman

MATLAB: An Introduction with Applications
Statistics
ISBN:9781119256830
Author:Amos Gilat
Publisher:John Wiley & Sons Inc

Probability and Statistics for Engineering and th...
Statistics
ISBN:9781305251809
Author:Jay L. Devore
Publisher:Cengage Learning

Statistics for The Behavioral Sciences (MindTap C...
Statistics
ISBN:9781305504912
Author:Frederick J Gravetter, Larry B. Wallnau
Publisher:Cengage Learning

Elementary Statistics: Picturing the World (7th E...
Statistics
ISBN:9780134683416
Author:Ron Larson, Betsy Farber
Publisher:PEARSON

The Basic Practice of Statistics
Statistics
ISBN:9781319042578
Author:David S. Moore, William I. Notz, Michael A. Fligner
Publisher:W. H. Freeman

Introduction to the Practice of Statistics
Statistics
ISBN:9781319013387
Author:David S. Moore, George P. McCabe, Bruce A. Craig
Publisher:W. H. Freeman