MATLAB: An Introduction with Applications
6th Edition
ISBN: 9781119256830
Author: Amos Gilat
Publisher: John Wiley & Sons Inc
expand_more
expand_more
format_list_bulleted
Question

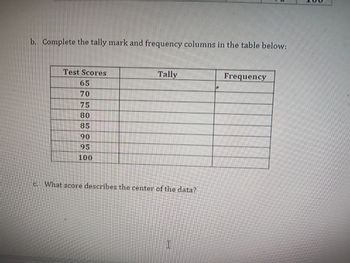
Transcribed Image Text:b. Complete the tally mark and frequency columns in the table below:
Test Scores
65
70
75
80
85
90
95
100
Tally
c. What score describes the center of the data?
I
Frequency
Expert Solution
This question has been solved!
Explore an expertly crafted, step-by-step solution for a thorough understanding of key concepts.
Step by stepSolved in 2 steps with 5 images

Knowledge Booster
Similar questions
- Find the percentile for the data point. Data set: 51 33 41 72 74 75 32;data point 51arrow_forwardFind the following for the data shown: 1 5 14 17 30 31 39 44 49 55 74 86 94 100 What is the percentile of the data value 44? Round to the nearest whole number. Which data value represents the 20th percentile?arrow_forwardFind the mean of the data from the frequency table: Value Frequency 0 6 1 0 2 6 3 8 4 9 5 6 Give your answer to two decimal places.arrow_forward
- Data were gathered from two groups and displayed in the line plots. Data Set A Data Set Barrow_forward25arrow_forwardTwenty five right-handed students were asked to turn a knob (using their right hands) that moved an indicator by screw action. There were two identical instruments, one with a right-hand thread (the knob turns clockwise) and the other with a left-hand thread (the knob turns counterclockwise). The data presented below gives the times (in seconds) each subject took to move the indicator a fixed distance: Obs.# R Obs.# R L L Obs.# R 1 113 8 116 166 22 100 2 105 105 9 75 146 23 89 3 130 133 10 96 123 24 85 4 101 108 11 122 135 25 88 5 138 115 12 103 6 118 170 13 116 7 87 103 14 107 At 1% level of significance, can we conclude that these right-handed students found it easier to use the knobs with a right-hand thread? Use the following form of the difference: right-left. 1. Test Stat: L 137 2. Critical Region: a. T> 2.492 b. Tabs (2.492) c. T> abs (-2.492) d. T < -2.492 Obs.# R 15 118 16 103 17 111 18 104 19 111 147 20 89 87 21 78 145 78 107 84 148 112 93 76 L 116 78 101 123 3. Conclusion:…arrow_forward
- a) Create a frequency table to organize the data b) Create a frequency histogram for the data ( 1. Write each column- Sum, Tally, Frequency 2. Give the frequency histogram) c) State 2 any trends, patterns or observations in this data? ( Describe each trend in detail ) d) What proportion, as a fraction, of the data has a value of 6 or less? e) What number of data has a value of 9 or greater? f) What percentage of the data has a value of 9 or greater?arrow_forwardFind the 5 number summary for the data shown 59 42 58 57 98 87 91 71 50 45 96 5 8 40 37 72 5 number summary:, , , , ,arrow_forwardFind the 5-number summary for the data shown 23 51 52 56 60 67 76 89 92 94 5 number summary:Find the lower fence: Find the upper fencearrow_forward
- Now consider a bag of ten colorful marbles. You reach into the bag 100 times. Each time you pull out a marble, write down what color it was, then put it back in the bag and do it again. You record the following data: Table describing marble frequency Color Frequency Red 22 Yellow 9 Green 41 Blue 28arrow_forwardA drink vendor randomly asked college students how many soft drinks they had consumed during the past week. Their answers were as follows: 5,0,2,1.1.9,0,1,0,3,1.1.4,3,4, and 7. a. Make a frequency table (NOT grouped). b. Make a histogram based on the frequency table. c. Make a frequency polygon based on the frequency table. d. Describe the shape of the histogram (i.e., mode?, skewed? etc.).arrow_forwardWhich of these frequency counts would be represented by the smallest number of dots on a dot plot? A. 8 B. 9 C. 7 D. 6arrow_forward
arrow_back_ios
SEE MORE QUESTIONS
arrow_forward_ios
Recommended textbooks for you
 MATLAB: An Introduction with ApplicationsStatisticsISBN:9781119256830Author:Amos GilatPublisher:John Wiley & Sons Inc
 Probability and Statistics for Engineering and th...StatisticsISBN:9781305251809Author:Jay L. DevorePublisher:Cengage Learning
 Statistics for The Behavioral Sciences (MindTap C...StatisticsISBN:9781305504912Author:Frederick J Gravetter, Larry B. WallnauPublisher:Cengage Learning
 Elementary Statistics: Picturing the World (7th E...StatisticsISBN:9780134683416Author:Ron Larson, Betsy FarberPublisher:PEARSON
 The Basic Practice of StatisticsStatisticsISBN:9781319042578Author:David S. Moore, William I. Notz, Michael A. FlignerPublisher:W. H. Freeman
 Introduction to the Practice of StatisticsStatisticsISBN:9781319013387Author:David S. Moore, George P. McCabe, Bruce A. CraigPublisher:W. H. Freeman

MATLAB: An Introduction with Applications
Statistics
ISBN:9781119256830
Author:Amos Gilat
Publisher:John Wiley & Sons Inc

Probability and Statistics for Engineering and th...
Statistics
ISBN:9781305251809
Author:Jay L. Devore
Publisher:Cengage Learning

Statistics for The Behavioral Sciences (MindTap C...
Statistics
ISBN:9781305504912
Author:Frederick J Gravetter, Larry B. Wallnau
Publisher:Cengage Learning

Elementary Statistics: Picturing the World (7th E...
Statistics
ISBN:9780134683416
Author:Ron Larson, Betsy Farber
Publisher:PEARSON

The Basic Practice of Statistics
Statistics
ISBN:9781319042578
Author:David S. Moore, William I. Notz, Michael A. Fligner
Publisher:W. H. Freeman

Introduction to the Practice of Statistics
Statistics
ISBN:9781319013387
Author:David S. Moore, George P. McCabe, Bruce A. Craig
Publisher:W. H. Freeman