
MATLAB: An Introduction with Applications
6th Edition
ISBN: 9781119256830
Author: Amos Gilat
Publisher: John Wiley & Sons Inc
expand_more
expand_more
format_list_bulleted
Related questions
Question
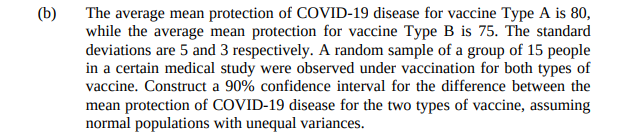

Transcribed Image Text:(b)
The average mean protection of COVID-19 disease for vaccine Type A is 80,
while the average mean protection for vaccine Type B is 75. The standard
deviations are 5 and 3 respectively. A random sample of a group of 15 people
in a certain medical study were observed under vaccination for both types of
vaccine. Construct a 90% confidence interval for the difference between the
mean protection of COVID-19 disease for the two types of vaccine, assuming
normal populations with unequal variances.
Expert Solution
This question has been solved!
Explore an expertly crafted, step-by-step solution for a thorough understanding of key concepts.

Step by stepSolved in 3 steps with 3 images

Knowledge Booster

Similar questions
- A study was conducted that measured the total brain volume (TBV) (in mm³) of patients that had schizophrenia and patients that are considered normal. The first table contains the TBV of the non- schizophrenic patients and the second table contains the TBV of schizophrenia patients. Compute a 95% confidence interval for the difference in TBV of non-schizophrenic patients and patients with Schizophrenia. Prior studies say nothing about the equality of variances. Round to the nearest whole number. Total Brain Volume (in mm³) of Non-Schizophrenic Patients 1493670 1505354 1642063 1269967 1520437 1581952 1550295 1549683 1338983 1422347 1492283 1195153 1396509 1478392 1485412 1618109 1459455 1717233 1357073 1576932 1417992 1548420 1484842 1595374 1679448 1569374 1370347 1389635 1396599 1533894 1565016 1340012 Total Brain Volume (in mm³) of Schizophrenia Patients 1274453 1212643 1523072 1543675 1466250 1299458 1283251 1592091 1730346 1074105 1362385 1435833 1603966 1523104 1248181 1424469…arrow_forwarda clinical trial was conducted to test the effectiveness of a drug used for treating insomnia in older subjects. After treatment with the drug, 17 subjects had a mean wake time of 94.4 min and a standard deviation of 41.8 min. Assume that the 17 sample values appear to be from a normally distributed population and construct a 95% confidence interval estimate of the standard deviation of the wake times for a population with the drug treatments. Does the result indicate whether the treatment is effective ?arrow_forwardA clinical trial was conducted to test the effectiveness of a drug used for treating insomnia in older subjects. After treatment with the drug, 21 subjects had a mean wake time of 92.5 min and a standard deviation of 43.5 min. Assume that the 21 sample values appear to be from a normally distributed population and construct a 90% confidence interval estimate of the standard deviation of the wake times for a population with the drug treatments. Does the result indicate whether the treatment is effective? Find the confidence interval estimate. O minarrow_forward
- A generic drug is being tested to test its efficacy (effectiveness) at reducing blood pressure in patients with hypertension (a.k.a. high blood pressure). In a randomized, double-blind experiment with 200 patients, 100 are given the name-brand drug (control group) and 100 are given a generic version of the drug (treatment group). In the control group, the average reduction in blood pressure is 15.2 mmHG with a standard deviation of 11.5 mmHG. In the treatment group, there is an average reduction of 14.6 mmHG and a standard deviation of 12.5 mmHG. Neither group has any outliers. A researcher claims that this study shows the generic drug is not as effective as the name-brand drug. What would be the reply of a statistician? You have two attempts for this problem so choose wisely. If you do not receive 5 points in the Gradebook after submitting this assignment then you have answered incorrectly. Make sure to try it again before the deadline. O Because the difference in sample means is…arrow_forwardIn a test of the effectiveness of garlic for lowering cholesterol, 48 subjects were treated with garlic in a processed tablet form. Cholesterol levels were measured before and after the treatment. The changes (before - after) in their levels of LDL cholesterol (in mg/dL) have a mean of 5.5 and a standard deviation of 19.8. Construct a 99% confidence interval estimate of the mean net change in LDL cholesterol after the garlic treatment. What does the confidence interval suggest about the effectiveness of garlic in reducing LDL cholesterol? Click here to view at distribution table. Click here to view page 1 of the standard normal distribution table, Click here to view page 2 of the standard normal distribution table. What is the confidence interval estimate of the population mean u? O mg/dL < µarrow_forwardA study was conducted that measured the total brain volume (TBV) (in mm³) of patients that had schizophrenia and patients that are considered normal. The first table contains the TBV of the non- schizophrenic patients and the second table contains the TBV of schizophrenia patients. Compute a 99% confidence interval for the difference in TBV of non-schizophrenic patients and patients with Schizophrenia. Prior studies say nothing about the equality of variances. Round to the nearest whole number. Total Brain Volume (in mm³) of Non-Schizophrenic Patients 1487997 1611227 1527495 1409812 1297379 1400278 1724615 1249097 1309037 1546157 1352710 1620645 1446958 1540957 1535216 1303042 1363737 1318121 1460479 1602502 1353583 1292976 1558222 1474289 1541397 1373993 1398046 1282528 1516312 1567897 1532468 1381812 Total Brain Volume (in mm³) of Schizophrenia Patients 1653156 1037545 1063003 1287704 1262253 1455977 1438274 1280706 1451005 1283081 1214368 1536994 1082431 1372061 1096716 1699683…arrow_forward
- A clinical trial was conducted to test the effectiveness of a drug used for treating insomnia in older subjects. After treatment with the drug, 16 subjects had a mean wake time of 92.6 min and a standard deviation of 40.2 min. Assume that the 16 sample values appear to be from a normally distributed population and construct a 98% confidence interval estimate of the standard deviation of the wake times for a population with the drug treatments. Does the result indicate whether the treatment is effective? Find the confidence interval estimate. minarrow_forwardA clinical trial was conducted to test the effectiveness of a drug used for treating insomnia in older subjects. After treatment with the drug, 20 subjects had a mean wake time of 92.5 min and a standard deviation of 43.9 min. Assume that the 20 sample values appear to be from a normally distributed population and construct a 90% confidence interval estimate of the standard deviation of the wake times for a population with the drug treatments. Does the result indicate whether the treatment is effective? Find the confidence interval estimate. minarrow_forwardA clinical trial was conducted to test the effectiveness of a drug used for treating insomnia in older subjects. After treatment with the drug, 11 subjects had a mean wake time of 97.2 min and a standard deviation of 43.4 min. Assume that the 11 sample values appear to be from a normally distributed population and construct a 90% confidence interval estimate of the standard deviation of the wake times for a population with the drug treatments. Does the result indicate whether the treatment is effective? Find the confidence interval estimate. (answer) min less then σ less than (answer) minarrow_forward
- A randomized controlled trial is run to evaluate the effectiveness of a new drug for asthma in children. A total of 250 children are randomized to either the new drug or a placebo (125 per group). The mean age of children assigned to the new drug is 12.4 with a standard deviation of 3.6 years. The mean age of children assigned to the placebo is 13.0 with a standard deviation of 4.0 years. Suppose that there are 63 boys assigned to the new drug group and 58 boys assigned to the placebo group. Is there a statistically significant difference in the proportions of boys assigned to the treatments? Run the appropriate test at a 5% level of significance.arrow_forwardA random sample of 12 chemists from Washington State shows an average salary of $39,420 with a standard deviation of $1659, while a random sample of 26 chemists from New Mexico has an average salary of $30,215 with a standard deviation of $4116. Is there a significant difference between the two states in chemists' salaries at a=0.02? Find the 98% confidence interval of the difference in the means in Chemist salaries?arrow_forward
arrow_back_ios
arrow_forward_ios
Recommended textbooks for you
- MATLAB: An Introduction with ApplicationsStatisticsISBN:9781119256830Author:Amos GilatPublisher:John Wiley & Sons Inc
 Probability and Statistics for Engineering and th...StatisticsISBN:9781305251809Author:Jay L. DevorePublisher:Cengage Learning
 Statistics for The Behavioral Sciences (MindTap C...StatisticsISBN:9781305504912Author:Frederick J Gravetter, Larry B. WallnauPublisher:Cengage Learning
  Elementary Statistics: Picturing the World (7th E...StatisticsISBN:9780134683416Author:Ron Larson, Betsy FarberPublisher:PEARSON
 The Basic Practice of StatisticsStatisticsISBN:9781319042578Author:David S. Moore, William I. Notz, Michael A. FlignerPublisher:W. H. Freeman
 Introduction to the Practice of StatisticsStatisticsISBN:9781319013387Author:David S. Moore, George P. McCabe, Bruce A. CraigPublisher:W. H. Freeman
MATLAB: An Introduction with Applications
Statistics
ISBN:9781119256830
Author:Amos Gilat
Publisher:John Wiley & Sons Inc
Probability and Statistics for Engineering and th...
Statistics
ISBN:9781305251809
Author:Jay L. Devore
Publisher:Cengage Learning
Statistics for The Behavioral Sciences (MindTap C...
Statistics
ISBN:9781305504912
Author:Frederick J Gravetter, Larry B. Wallnau
Publisher:Cengage Learning
Elementary Statistics: Picturing the World (7th E...
Statistics
ISBN:9780134683416
Author:Ron Larson, Betsy Farber
Publisher:PEARSON
The Basic Practice of Statistics
Statistics
ISBN:9781319042578
Author:David S. Moore, William I. Notz, Michael A. Fligner
Publisher:W. H. Freeman
Introduction to the Practice of Statistics
Statistics
ISBN:9781319013387
Author:David S. Moore, George P. McCabe, Bruce A. Craig
Publisher:W. H. Freeman