MATLAB: An Introduction with Applications
6th Edition
ISBN: 9781119256830
Author: Amos Gilat
Publisher: John Wiley & Sons Inc
expand_more
expand_more
format_list_bulleted
Question

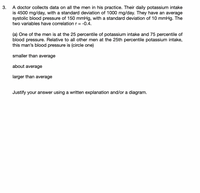
Transcribed Image Text:A doctor collects data on all the men in his practice. Their daily potassium intake
is 4500 mg/day, with a standard deviation of 1000 mg/day. They have an average
systolic blood pressure of 150 mmHg, with a standard deviation of 10 mmHg. The
two variables have correlation r =
3.
-0.4.
(a) One of the men is at the 25 percentile of potassium intake and 75 percentile of
blood pressure. Relative to all other men at the 25th percentile potassium intake,
this man's blood pressure is (circle one)
smaller than average
about average
larger than average
Justify your answer using a written explanation and/or a diagram.

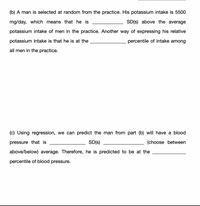
Transcribed Image Text:(b) A man is selected at random from the practice. His potassium intake is 5500
mg/day, which means that he is
SD(s) above the average
potassium intake of men in the practice. Another way of expressing his relative
potassium intake is that he is at the
percentile of intake among
all men in the practice.
(c) Using regression, we can predict the man from part (b) will have a blood
pressure that is
SD(s)
(choose between
above/below) average. Therefore, he is predicted to be at the
percentile of blood pressure.
Expert Solution
This question has been solved!
Explore an expertly crafted, step-by-step solution for a thorough understanding of key concepts.
Step by stepSolved in 2 steps

Knowledge Booster
Similar questions
- You work as a data scientist for a real estate company in a seaside resort town. Your boss has asked you to discover if it's possible to predict how much a home's distance from the water affects its selling price. You are going to collect a random sample of 7 recently sold homes in your town. You will note the distance each home is from the water (denoted by x, in km) and each home's selling price (denoted by y, in hundreds of thousands of dollars). You will also note the product x.y of the distance from the water and selling price for each home. (These products are written in the row labeled "xy"). (a) Click on "Take Sample" to see the results for your random sample. Distance from the water, .x (in km) Take Sample Selling price, y (in hundreds of thousands of dollars) xy Send data to calculator Based on the data from your sample, enter the indicated values in the column on the left below. Round decimal values to three decimal places. When you are done, select "Compute". (In the table…arrow_forwardThe table below gives the number of weeks of gestation and the birth weight (in pounds) for a sample of five randomly selected babies. Using this data, consider the equation of the regression line, ŷ = bọ + b1x, for predicting the birth weight of a baby based on the number of weeks of gestation. Keep in mind, the correlation coefficient may or may not be statistically significant for the data given. Remember, in practice, it would not be appropriate to use the regression line to make a prediction if the correlation coefficient is not statistically significant. Weeks of Gestation 33 34 36 38 41 Weight (in pounds) 6. 6.1 6.8 7.3 7.9 Table Copy Data Step 5 of 6: Find the error prediction when x = 36. Round your answer to three decimal places.arrow_forwardThe adjusted R-squared accounts for the amount of variance explained while also adjusting for the number of independent variables in the linear regression equation. True or Falsearrow_forward
- The table below gives the age and bone density for five randomly selected women. Using this data, consider the equation of the regression line, yˆ=b0+b1^x, for predicting a woman's bone density based on her age. Keep in mind, the correlation coefficient may or may not be statistically significant for the data given. Remember, in practice, it would not be appropriate to use the regression line to make a prediction if the correlation coefficient is not statistically significant. Age Bone Density35 35043 34053 33954 32155 310 Step 3 of 6 : Determine if the statement "Not all points predicted by the linear model fall on the same line" is true or false.arrow_forwardThe table below gives the number of hours spent unsupervised each day as well as the overall grade averages for five randomly selected middle school students. Using this data, consider the equation of the regression line, yˆ=b0+b1x, for predicting the overall grade average for a middle school student based on the number of hours spent unsupervised each day. Keep in mind, the correlation coefficient may or may not be statistically significant for the data given. Remember, in practice, it would not be appropriate to use the regression line to make a prediction if the correlation coefficient is not statistically significant. Hours Unsupervised 2 3 4 5 6 Overall Grades 94 86 79 71 62 Table Step 1 of 6 : Find the estimated slope, y intercept and correlation coefficient Round your answer to three decimal places. Answerarrow_forwardThe table below gives the number of hours spent unsupervised each day as well as the overall grade averages for seven randomly selected middle school students. Using this data, consider the equation of the regression line, yˆ=b0+b1x, for predicting the overall grade average for a middle school student based on the number of hours spent unsupervised each day. Keep in mind, the correlation coefficient may or may not be statistically significant for the data given. Remember, in practice, it would not be appropriate to use the regression line to make a prediction if the correlation coefficient is not statistically significant. Hours Unsupervised 0 1 1.5 2.5 4 5.5 6 Overall Grades 98 86 85 83 80 78 67 Table Step 1 of 6: Find the estimated slope, y intercept, correlation cofficient Round your answers to three decimal places.arrow_forward
- The table below gives the age and bone density for five randomly selected women. Using this data, consider the equation of the regression line, yˆ=b0+b1^x, for predicting a woman's bone density based on her age. Keep in mind, the correlation coefficient may or may not be statistically significant for the data given. Remember, in practice, it would not be appropriate to use the regression line to make a prediction if the correlation coefficient is not statistically significant. Age Bone Density35 35043 34053 33954 32155 310 Step 4 of 6 : Determine the value of the dependent variable yˆ at x=0.arrow_forwardThe table below gives the number of hours spent unsupervised each day as well as the overall grade averages for five randomly selected middle school students. Using this data, consider the equation of the regression line, yˆ=b0+b1x, for predicting the overall grade average for a middle school student based on the number of hours spent unsupervised each day. Keep in mind, the correlation coefficient may or may not be statistically significant for the data given. Remember, in practice, it would not be appropriate to use the regression line to make a prediction if the correlation coefficient is not statistically significant. Hours Unsupervised 0 1 3 4 5 Overall Grades 95 92 85 81 62 Table Step 4 of 6 : Find the estimated value of y when x=3. Round your answer to three decimal places. Answer How to enter your answer (opens in new window)arrow_forwardThe table below gives the number of weeks of gestation and the birth weight (in pounds) for a sample of five randomly selected babies. Using this data, consider the equation of the regression line, y = bo + b1x, for predicting the birth weight of a baby based on the number of weeks of gestation. Keep in mind, the correlation coefficient may or may not be statistically significant for the data given. Remember, in practice, it would not be appropriate to use the regression line to make a prediction if the correlation coefficient is not statistically significant. Weeks of Gestation 33 34 36 38 41 Weight (in pounds) 6 6.1 6.8 7.3 7.9 Table Copy Data Step 4 of 6: Find the estimated value of y when x = 36. Round your answer to three decimal places.arrow_forward
- The table below gives the number of hours ten randomly selected students spent studying and their corresponding midterm exam grades. Using this data, consider the equation of the regression line, yˆ=b0+b1x, for predicting the midterm exam grade that a student will earn based on the number of hours spent studying. Keep in mind, the correlation coefficient may or may not be statistically significant for the data given. Remember, in practice, it would not be appropriate to use the regression line to make a prediction if the correlation coefficient is not statistically significant. Hours Studying 0 0.5 1.5 2 2.5 3 4.5 5 5.5 6 Midterms Grades 60 63 64 69 73 76 82 90 91 95 Step 1 of 6: Find the estimated slope. Round your answer to three decimal places. Step 2 of 6: Find the estimated y-intercept. Round your answer to three decimal places. Step 3 of 6: Determine if the statement "All points predicted by the linear model fall on the same line" is true or false Step 4 of 6:…arrow_forwardThe table below gives the number of hours spent unsupervised each day as well as the overall grade averages for five randomly selected middle school students. Using this data, consider the equation of the regression line, yˆ=b0+b1x, for predicting the overall grade average for a middle school student based on the number of hours spent unsupervised each day. Keep in mind, the correlation coefficient may or may not be statistically significant for the data given. Remember, in practice, it would not be appropriate to use the regression line to make a prediction if the correlation coefficient is not statistically significant. Hours Unsupervised 0 2 3 5 6 Overall Grades 90 89 87 77 61 Table Step 2 of 6 : Find the estimated y-intercept. Round your answer to three decimal places.arrow_forwardThe correlation between two variables x and y is –0.6. If we used a regression line to predict y using x, what percent of the variation in y would be explained?arrow_forward
arrow_back_ios
SEE MORE QUESTIONS
arrow_forward_ios
Recommended textbooks for you
 MATLAB: An Introduction with ApplicationsStatisticsISBN:9781119256830Author:Amos GilatPublisher:John Wiley & Sons Inc
 Probability and Statistics for Engineering and th...StatisticsISBN:9781305251809Author:Jay L. DevorePublisher:Cengage Learning
 Statistics for The Behavioral Sciences (MindTap C...StatisticsISBN:9781305504912Author:Frederick J Gravetter, Larry B. WallnauPublisher:Cengage Learning
 Elementary Statistics: Picturing the World (7th E...StatisticsISBN:9780134683416Author:Ron Larson, Betsy FarberPublisher:PEARSON
 The Basic Practice of StatisticsStatisticsISBN:9781319042578Author:David S. Moore, William I. Notz, Michael A. FlignerPublisher:W. H. Freeman
 Introduction to the Practice of StatisticsStatisticsISBN:9781319013387Author:David S. Moore, George P. McCabe, Bruce A. CraigPublisher:W. H. Freeman

MATLAB: An Introduction with Applications
Statistics
ISBN:9781119256830
Author:Amos Gilat
Publisher:John Wiley & Sons Inc

Probability and Statistics for Engineering and th...
Statistics
ISBN:9781305251809
Author:Jay L. Devore
Publisher:Cengage Learning

Statistics for The Behavioral Sciences (MindTap C...
Statistics
ISBN:9781305504912
Author:Frederick J Gravetter, Larry B. Wallnau
Publisher:Cengage Learning

Elementary Statistics: Picturing the World (7th E...
Statistics
ISBN:9780134683416
Author:Ron Larson, Betsy Farber
Publisher:PEARSON

The Basic Practice of Statistics
Statistics
ISBN:9781319042578
Author:David S. Moore, William I. Notz, Michael A. Fligner
Publisher:W. H. Freeman

Introduction to the Practice of Statistics
Statistics
ISBN:9781319013387
Author:David S. Moore, George P. McCabe, Bruce A. Craig
Publisher:W. H. Freeman