
Related questions
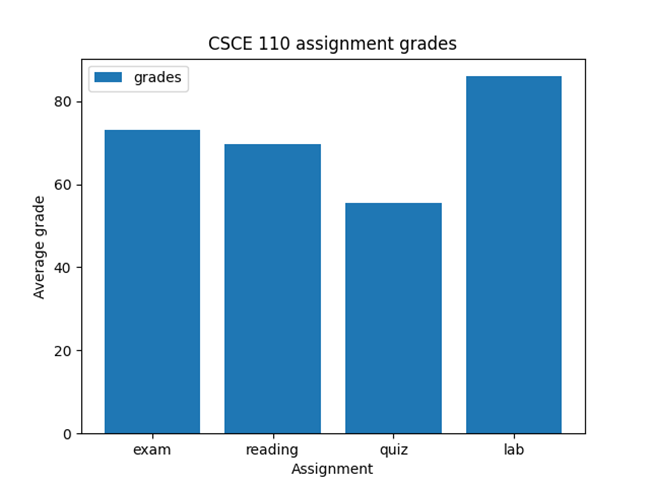
Average grades bar chart
Write a python program grades.py that reads a file of assignment grades and draws a bar chart of the average grades for each assignment.
Save the figure as grades.png in the current working directory.
The format of a line in the file is: assignment_type grade
Note that there is a single space between the assignment type and the grade. E.g. exam 92.80
Your program must contain the following functions:
|
Function name |
Function description |
Function input(s) |
Function return value(s) |
|---|---|---|---|
|
get_grades() |
This function takes a file name as input and populates a dictionary containing the assignment types and grades. |
Filename string |
Dictionary of grades |
|
main() |
This function prompts for the grades file name. Next, it calls the functions get_grades(). Next, it draws the bar chart of the average grade for each assignment. Hint: You can use the mean function of the statistics module to calculate the average of a list. |
None |
None |
Use the starter code here
import matplotlib.pyplot as drawing
import statistics
def get_grades(filename):
""" This function takes a file name as input and populates a dictionary containing the assignment types and grades.
@param filename:
@return: dictionary of grades """
gradebook = dict()
# todo
return gradebook
def main():
""" This function prompts for the grades file name. Next, it calls the functions get_grades(). Next, it draws the bar chart of the average grade for each assignment.
@return: """
filename = input("Enter the grade file name: ")
gradebook = get_grades(filename)
print(f'The dictionary of grades is: {gradebook}')
# todo
if __name__ == '__main__':
main()
Some sample score files are provided (these are examples only-you do not need to assume these will be the same numbers)
quiz 98
quiz 60.25
exam 92.80
quiz 100
exam 50
lab 82.76
quiz 75
quiz 76.23
quiz 82
lab 89
lab 100
exam 95.1
lab 76.88
Ex 2
exam 79
reading 25
reading 90
reading 93.08
quiz 40
exam 68.32
exam 72
quiz 46
quiz 80.19
lab 100
lab 80
reading 71
lab 78
Sample output
|
Enter the grade file name: grades1.txt The dictionary of grades is: {'quiz': [98.0, 60.25, 100.0, 75.0, 76.23, 82.0], 'exam': [92.8, 50.0, 95.1], 'lab': [82.76, 89.0, 100.0, 76.88]} |
Expected bar chart below
Sample output
|
Enter the grade file name: data/grades2.txt The dictionary of grades is: {'exam': [79.0, 68.32, 72.0], 'reading': [25.0, 90.0, 93.08, 71.0], 'quiz': [40.0, 46.0, 80.19], 'lab': [100.0, 80.0, 78.0]} |
Expected bar chart below


Trending nowThis is a popular solution!

Step by stepSolved in 3 steps with 2 images


- : Animating a Plot Problem: The MATLAB code with the initial conditions and one dimensional motion equation are given in the MProject2_Assignment1_base.m file. Modify the code to explore how to animate the plot, use functions to create plot functionarrow_forwardIn C/C++, True or False: A function that changes the value of a variable passed by reference also changes the value of the original variable. A variable's type helps define the amount of memory it takes to hold a value of that type.arrow_forwardA header of a C-language function is: void recurs(int current_level, int max_level ) The keyword "void" here signifiesarrow_forward
- C++ Create a function that will read the following .txt file contents and put them into an array: "apple", "avocado", "apricot","banana", "blackberry", "blueberry", "boysenberry","cherry", "cantaloupe", "cranberry", "coconut", "cucumber", "currant","date", "durian", "dragonfruit","elderberry",arrow_forwarduse pycharm/pythonarrow_forwardAssignment Name JavaScript Concepts III Assignment Filename lastname-circleArea.html (replace lastname with your last name). area.js Assignment Description This assignment demonstrates the following concepts: JavaScript Functions Assignment Instructions Write a JavaScript program that calculates the area of a circle: Write a function that calculates the area of a circle given the radius. Formula: Math.PI * (radius * radius) Your program code should contain appropriately named variables. Use documentation to identify various components of your program. Call the function once and pass a radius value of 10.75 to it. Use the starter files and complete the logic to satisfy the instructions. To access the files, download and save the circleArea.zip folder attached to this assignment. Then unzip the compressed folder to reveal the included files: circleArea.html and area.js. Be sure that the two files are in the same folder. Then write your code in the area.js…arrow_forward
- # Exercise 8: Create a function that takes the sum of three numbers and returns the value # Make sure to use the function and display the result # When you are done, get 3 numbers from a user and then print out the sum using your functionarrow_forward# dates and times with lubridateinstall.packages("nycflights13") library(tidyverse)library(lubridate)library(nycflights13) Qustion: Create a function called date_quarter that accepts any vector of dates as its input and then returns the corresponding quarter for each date Examples: “2019-01-01” should return “Q1” “2011-05-23” should return “Q2” “1978-09-30” should return “Q3” Etc. Use the flight's data set from the nycflights13 package to test your function by creating a new column called quarter using mutate()arrow_forwardCreate the pseudocode for a program that will Create a file of functions and place them into a functions.py file Make a new program called CallFunctions and import the functions.py file Call each of the functions in the functions filearrow_forward
- C++ formatting please Write a program (not a function) that reads from a file named "data.csv". This file consists of a list of countries and gold medals they have won in various Olympic events. Write to standard out, the top 5 countries with the most gold medals. You can assume there will be no ties. Expected Output: 1: United States with 1022 gold medals 2: Soviet Union with 440 gold medals 3: Germany with 275 gold medals 4: Great Britain with 263 gold medals 5: China with 227 gold medalsarrow_forwardHeader (.h) files contain all of the declarations of a program. Non-header (.cpp)files contain all the definitions… TRUE OR FALSEarrow_forwardIn this program, your task is to calculate average of grades and then display the final grade. Your tasks are as follows: Create a function called get_average() that takes a list containing grades of five subjects and calculates the average and returns it. Create a function called get_grade() that takes average of the five subjects from the get_average() function and displays the grade as per the table below:arrow_forward
- Computer Networking: A Top-Down Approach (7th Edi...Computer EngineeringISBN:9780133594140Author:James Kurose, Keith RossPublisher:PEARSON
 Computer Organization and Design MIPS Edition, Fi...Computer EngineeringISBN:9780124077263Author:David A. Patterson, John L. HennessyPublisher:Elsevier Science
 Network+ Guide to Networks (MindTap Course List)Computer EngineeringISBN:9781337569330Author:Jill West, Tamara Dean, Jean AndrewsPublisher:Cengage Learning
  Concepts of Database ManagementComputer EngineeringISBN:9781337093422Author:Joy L. Starks, Philip J. Pratt, Mary Z. LastPublisher:Cengage Learning
 Prelude to ProgrammingComputer EngineeringISBN:9780133750423Author:VENIT, StewartPublisher:Pearson Education
 Sc Business Data Communications and Networking, T...Computer EngineeringISBN:9781119368830Author:FITZGERALDPublisher:WILEY