MATLAB: An Introduction with Applications
6th Edition
ISBN: 9781119256830
Author: Amos Gilat
Publisher: John Wiley & Sons Inc
expand_more
expand_more
format_list_bulleted
Question
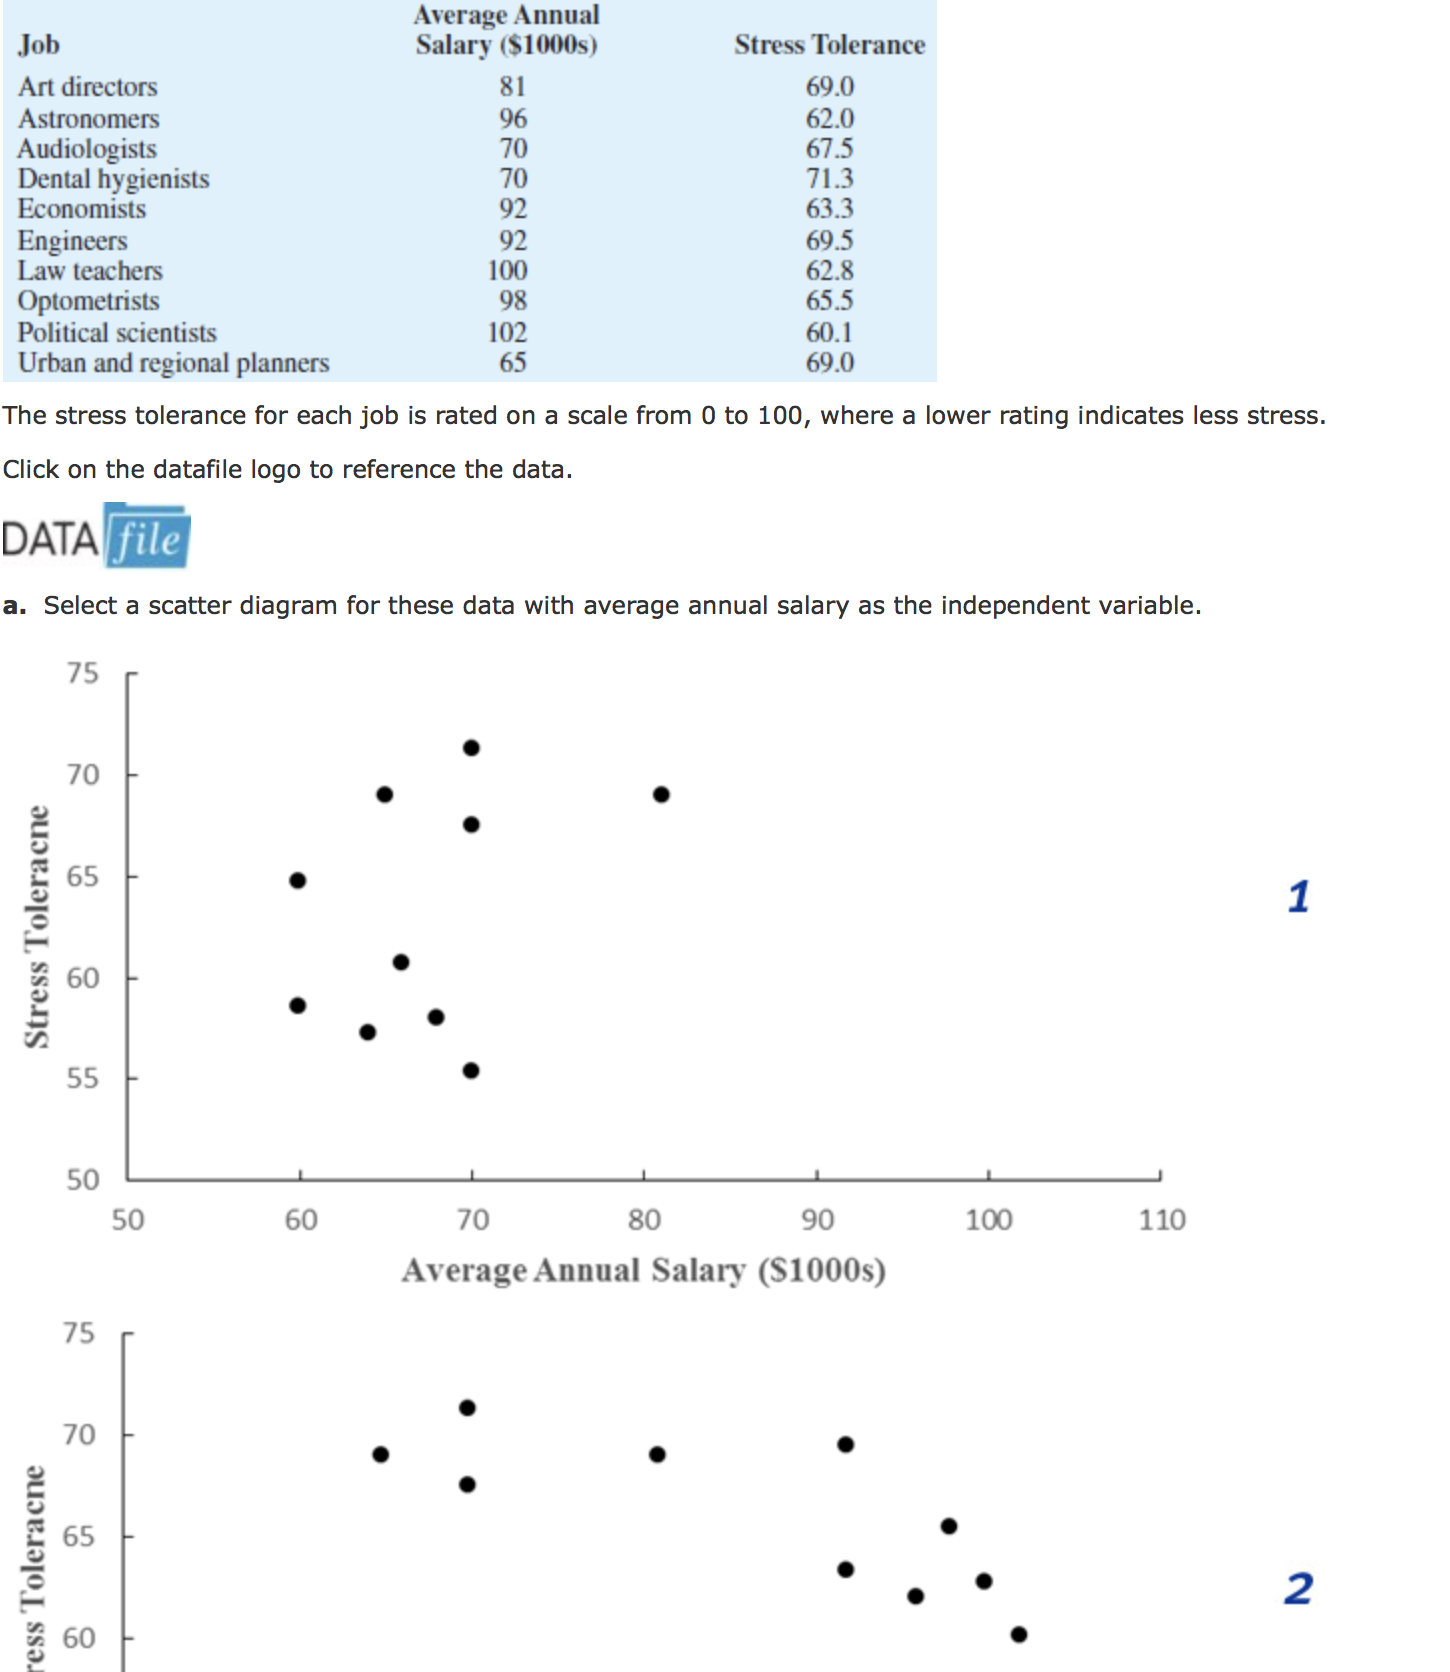
To identify high-paying jobs for people that do not like stress, the following data were collected showing the average annual salary ($1000) and the stress tolerance for a variety of occupations (Business Insider, November 8, 2013).

Transcribed Image Text:Average Annual
Salary ($1000s)
Job
Stress Tolerance
Art directors
81
69.0
Astronomers
Audiologists
Dental hygienists
Economists
96
70
70
92
62.0
67.5
71.3
63.3
69.5
62.8
65.5
60.1
69.0
Engineers
Law teachers
Optometrists
Political scientists
92
100
98
102
65
Urban and regional planners
The stress tolerance for each job is rated on a scale from 0 to 100, where a lower rating indicates less stress.
Click on the datafile logo to reference the data.
DATA file
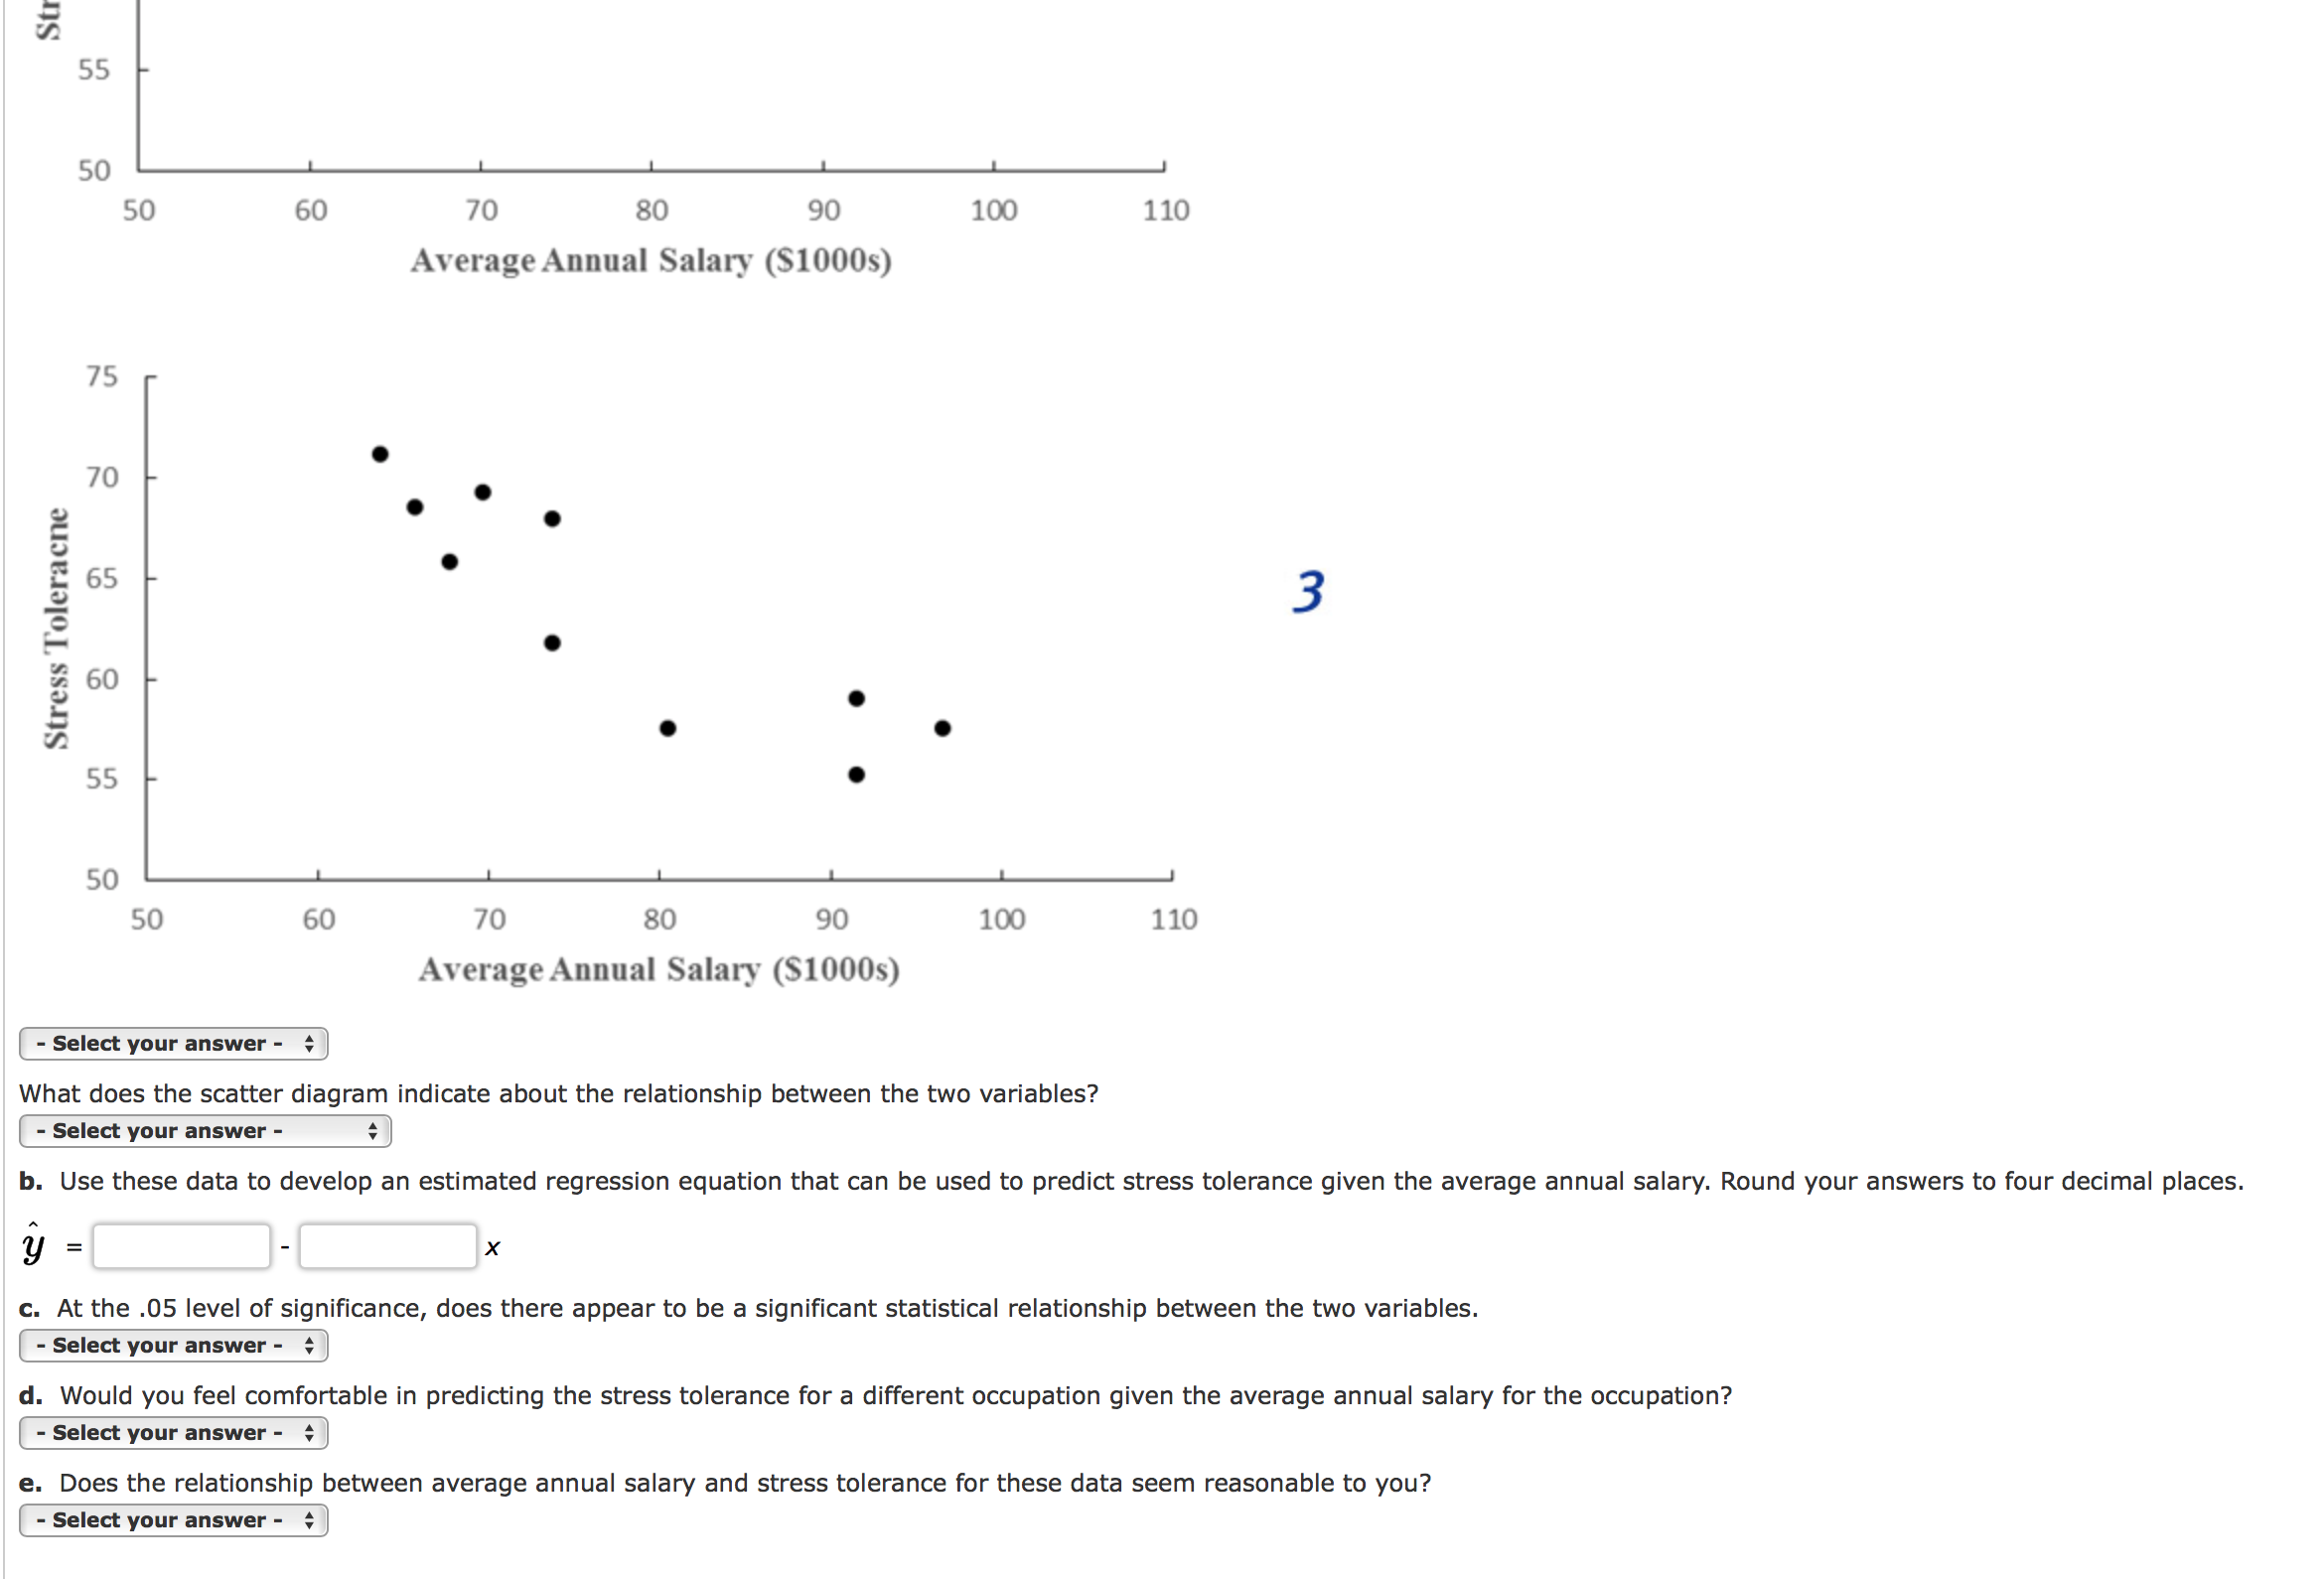
a. Select a scatter diagram for these data with average annual salary as the independent variable.
75
70
65
1
55
50
70
80
90
100
50
60
110
Average Annual Salary (S1000s)
75
65
60
ress Toleracne
Stress Toleracne
70
60
2.

Transcribed Image Text:55
50
60
70
80
90
100
50
110
Average Annual Salary ($1000s)
75
70
65
3
55
50
50
60
70
100
80
90
110
Average Annual Salary (S1000s)
- Select your answer -
What does the scatter diagram indicate about the relationship between the two variables?
- Select your answer -
b. Use these data to develop an estimated regression equation that can be used to predict stress tolerance given the average annual salary. Round your answers to four decimal places.
х
%3D
c. At the .05 level of significance, does there appear to be a significant statistical relationship between the two variables.
- Select your answer -
d. Would you feel comfortable in predicting the stress tolerance for a different occupation given the average annual salary for the occupation?
- Select your answer -
e. Does the relationship between average annual salary and stress tolerance for these data seem reasonable to you?
- Select your answer -
Stress Toleracne
Str
60
Expert Solution
This question has been solved!
Explore an expertly crafted, step-by-step solution for a thorough understanding of key concepts.
This is a popular solution
Trending nowThis is a popular solution!
Step by stepSolved in 7 steps with 3 images

Knowledge Booster
Learn more about
Need a deep-dive on the concept behind this application? Look no further. Learn more about this topic, statistics and related others by exploring similar questions and additional content below.Similar questions
- Absenteeism: Absenteeism can be a serious employment problem. It is estimated that absenteeism reduces potential output by more than 10%. Two economists launched a research project to learn more about the problem. They randomly selected 100 organizations to participate in a 1-year study. For each organization, they recorded the average number of days absent per employee and several variables thought to affect absenteeism. Management’s goal here is to analyze the data and determine which factors may be helpful in predicting absenteeism. Perform a two-sample t-test analysis to determine if mean absenteeism is different between organizations which have a good Union management and those that do not. I have provided the F-test for two variances below: Copy and paste the Two sample t-test output below AND provide a clear conclusion supported by key statistics in the output about how absenteeism is affected by the Union Management Relationship. (I just need to know how to perform the two…arrow_forwardPlease see below. I am only given one opportunity at this. Please help!! Successful hotel managers must have personality characteristics often thought of as feminine (such as "compassionate") as well as those often thought of as masculine (such as "forceful"). The Bem Sex-Role Inventory (BSRI) is a personality test that gives separate ratings for female and male stereotypes, both on a scale of 1 to 7. A sample of 148 male general mangers of three-star and four-star hotels had mean BSRI femininity score of 5.29 with a SD of 0.78. The mean score for the general male population is μ=5.19. Do hotel managers on the average differ significantly in femininity score from men in general? A 2-sample test for proportions B z-test for proportions C 2-sample test for means D t-test for means E z-test for meansarrow_forwardIs it defense or offense that wins football games? The accompanying data file includes a team’s winning record (Win in %), the average number of yards gained, and the average number of yards allowed during a recent NFL season. Team Win Yards_Gained Yards_Allowed Arizona Cardinals 46.9 366.8 305.2 Atlanta Falcons 68.8 415.8 371.2 Baltimore Ravens 50.0 347.7 322.1 Buffalo Bills 43.8 354.1 357.0 Carolina Panthers 37.5 343.7 359.8 Chicago Bears 18.8 356.5 346.8 Cincinnati Bengals 40.6 356.9 350.8 Cleveland Browns 6.2 311.0 392.4 Dallas Cowboys 81.2 376.7 343.9 Denver Broncos 56.2 323.1 316.1 Detroit Lions 56.2 338.8 354.8 Green Bay Packers 62.5 368.8 363.9 Houston Texans 56.2 314.7 301.3 Indianapolis Colts 50.0 364.4 382.9 Jacksonville Jaguars 18.8 334.9 321.7 Kansas City Chiefs 75.0 343.0 368.5 Miami Dolphins 25.0 262.7 337.0 Minnesota Vikings 62.5 332.8 382.6 New England Patriots 50.0 315.1 314.9 New Orleans Saints 87.5 386.2 326.4 New York…arrow_forward
- As an admissions counselor, I am interested in understanding whether or not there is a difference in stress levels not only between different majors but also between different classes (Freshman v. Seniors). I gather the following data from students from three majors (Psychology, Chemistry, and Engineering), that are in their freshmen or senior years and ask them about their stress levels (scale of 1-10, with lower numbers meaning less stress). Using the data below, test whether there are effects of class, major, or an interaction between them at an alpha of 0.05. Psychology Chemistry Engineering Freshmen 3, 4, 4, 2, 4 4, 5, 7, 8, 4 5, 7, 7, 8, 5 Senior 4, 5, 5, 3, 5 8, 5, 6, 7, 7 9, 9, 8, 7, 9 Complete the ANOVA summary table below: Source SS df MS (variance) F MAJOR CLASS MAJOR*CLASS ERROR/RESIDUAL Nothing here TOTAL Nothing here Nothing here What can we conclude?…arrow_forwardTheir body fat percentage scores were 20.3, 29.6, 32.4, 35.7, 28.4, 21.4, 26.6, 30.5, 23.4, 11.8, 21.3, 19.2, 19.4, 23.2, 7.2, 40.4, 27.8, 35.3, 40.5, and 43.6. What is the percentile rank of the person whose body fat percentage is (a) 35.3%; (b) 11.8%? Hint: Be sure to sort the scores from high to low (highest BMI at the top).arrow_forwardA researcher conducts an independent-measures study to examine how the brain chemical serotonin is related to aggression. One sample of rats serves as a control group and receives a placebo that does not affect normal levels of serotonin. A second sample of rats, low serotonin group, receives a drug that lowers brain levels of serotonin. Then, the researcher tests the animals by recording the number of aggressive responses each of the rats display. See the data below. Is there a significant difference between the control group and the low serotonin group regarding the number of aggressive responses? Control Low Serotonin n = 10 n = 15 M = 14 M = 19 SS = 180.5 SS = 130 Perform a hypothesis test using independent-measures t-test. Use a two-tailed…arrow_forward
- A researcher is interested in examining whether people experience greater traumatic stress after a natural disaster (hurricane) or a man-made tragedy (terrorist attack). The researcher measured the stress of 10 people who experienced a hurricane and 10 people who experienced a terrorist attack. Stress was measured on a scale from 1-5, with higher scores indicating greater stress. Enter their data (see below) into SPSS and answer the following questions. Hurricane Terrorist Attack 3.6 3.0 2.2 3.2 3.6 4.7 2.4 4.7 2.2 4.4 1.0 4.2 1.7 2.0 2.2 3.6 2.7 4.6 1.7 4.4 Run an independent t-test ?arrow_forwardA psychological study wants to analyze the relationship between anxiety and binge drinking; a questionnaire for anxiety and questionnaire for binge drinking is administered to each subject. What would be a good statistical test to test the hypothesis?arrow_forwardWhich of the following is the best measure of central tendency for age? Mode:55 Median:44.5 Mean:45.49arrow_forward
- Please apply table to question. Thanks!arrow_forwardA researcher gathered a sample of participants who volunteered for a studying of phobias. She measured anxiety level of participants as they viewed photos of spiders and again when they viewed puppies. Which statistical test is appropriate for this study and why?arrow_forwardRead the scenario below to determine which one of the time threats to internal validity (test reactivity, instrumentation, history, and maturation) is of most concern, and provide one way to control for the threat. A researcher examines students' perception of their body image by conducting a 2-year longitudinal study of middle-school students (grades 6 - 8). Body image is measured using a scale and the same scale is measured under the same conditions at the beginning and end of the study.arrow_forward
arrow_back_ios
SEE MORE QUESTIONS
arrow_forward_ios
Recommended textbooks for you
 MATLAB: An Introduction with ApplicationsStatisticsISBN:9781119256830Author:Amos GilatPublisher:John Wiley & Sons Inc
 Probability and Statistics for Engineering and th...StatisticsISBN:9781305251809Author:Jay L. DevorePublisher:Cengage Learning
 Statistics for The Behavioral Sciences (MindTap C...StatisticsISBN:9781305504912Author:Frederick J Gravetter, Larry B. WallnauPublisher:Cengage Learning
 Elementary Statistics: Picturing the World (7th E...StatisticsISBN:9780134683416Author:Ron Larson, Betsy FarberPublisher:PEARSON
 The Basic Practice of StatisticsStatisticsISBN:9781319042578Author:David S. Moore, William I. Notz, Michael A. FlignerPublisher:W. H. Freeman
 Introduction to the Practice of StatisticsStatisticsISBN:9781319013387Author:David S. Moore, George P. McCabe, Bruce A. CraigPublisher:W. H. Freeman

MATLAB: An Introduction with Applications
Statistics
ISBN:9781119256830
Author:Amos Gilat
Publisher:John Wiley & Sons Inc

Probability and Statistics for Engineering and th...
Statistics
ISBN:9781305251809
Author:Jay L. Devore
Publisher:Cengage Learning

Statistics for The Behavioral Sciences (MindTap C...
Statistics
ISBN:9781305504912
Author:Frederick J Gravetter, Larry B. Wallnau
Publisher:Cengage Learning

Elementary Statistics: Picturing the World (7th E...
Statistics
ISBN:9780134683416
Author:Ron Larson, Betsy Farber
Publisher:PEARSON

The Basic Practice of Statistics
Statistics
ISBN:9781319042578
Author:David S. Moore, William I. Notz, Michael A. Fligner
Publisher:W. H. Freeman

Introduction to the Practice of Statistics
Statistics
ISBN:9781319013387
Author:David S. Moore, George P. McCabe, Bruce A. Craig
Publisher:W. H. Freeman