
Related questions
Concept explainers
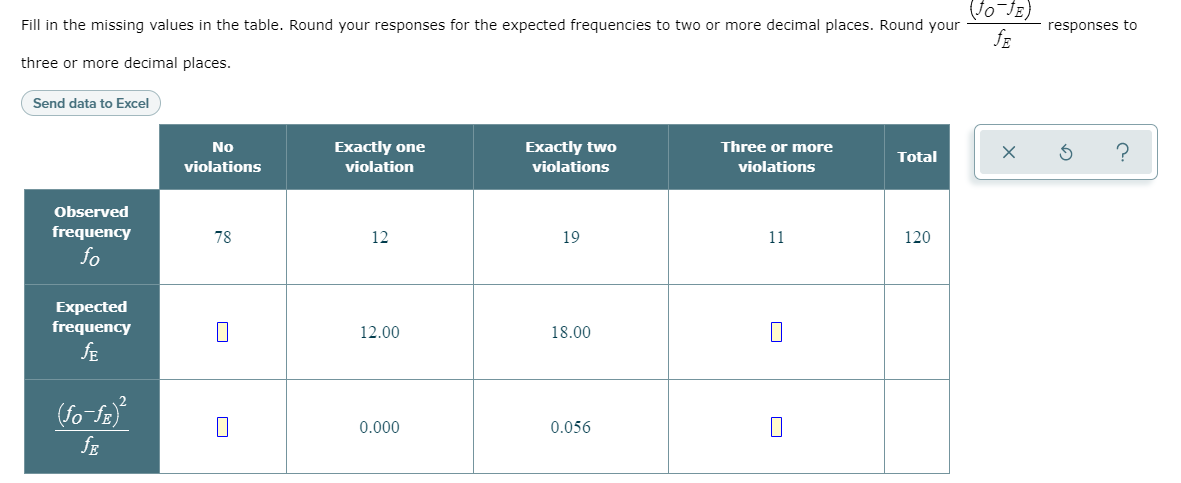
AutoWrecks, Inc. sells auto insurance. AutoWrecks keeps close tabs on its customers' driving records, updating its rates according to the trends indicated by these records. AutoWrecks' records indicate that, in a "typical" year, roughly 70% of the company's customers do not commit a moving violation, 10% commit exactly one moving violation, 15% commit exactly two moving violations, and 5% commit three or more moving violations.
This past year's driving records for a random sample of 120 AutoWrecks customers are summarized by the first row of numbers in the table below. That row gives this year's observed frequency for each moving violation category for the sample of 120 AutoWrecks customers. The second row of numbers gives the frequencies expected for a sample of 120 AutoWrecks customers if the moving violations distribution for this year is the same as the distribution for a "typical" year. The bottom row of numbers contains the following value for each of the moving violation categories.


Trending nowThis is a popular solution!

Step by stepSolved in 2 steps with 1 images


- Many investors and financial analysts believe the Dow Jones Industrial Average (DJIA) gives a good barometer of the overall stock market. On January 31, 2006, 9 of the 30 stocks making up the DJIA increased in price (The Wall Street Journal, February 1, 2006). On the basis of this fact, a financial analyst claims we can assume that 30% of the stocks traded on the New York Stock Exchange (NYSE) went up the same day.A sample of 64 stocks traded on the NYSE that day showed that 24 went up.You are conducting a study to see if the proportion of stocks that went up is significantly more than 0.3. You use a significance level of α=0.01α=0.01.What is the test statistic for this sample? (Report answer accurate to three decimal places.)test statistic = What is the p-value for this sample? (Report answer accurate to four decimal places.)p-value = The p-value is... less than (or equal to) αα greater than αα This test statistic leads to a decision to... reject the null accept the null fail to…arrow_forwardMany investors and financial analysts believe the Dow Jones Industrial Average (DJIA) gives a good barometer of the overall stock market. On January 31, 2017, 9 of the 30 stocks making up the DJIA increased in price.On the basis of this fact, a financial analyst claims we can assume that 76% of the stocks traded on the New York Stock Exchange (NYSE) went up the same day. A sample of 61 stocks traded on the NYSE that day showed that 43 went up. You are conducting a study to see if the proportion of stocks that went up is significantlysmaller than 76%. You use a significance level of α=0.01α=0.01. For this study, we should use Select an answer 2-SampTInt 2-PropZInt 1-PropZInt T-Test χ²GOF-Test 2-SampTTest 2-PropZTest TInterval ANOVA 1-PropZTest χ²-Test The null and alternative hypotheses would be: H0H0: ? p μ Select an answer > = < ≠ (please enter a decimal) H1H1: ? p μ Select an answer ≠ = > < (Please enter a decimal) The test statistic =…arrow_forwardMany investors and financial analysts believe the Dow Jones Industrial Average (DJIA) gives a good barometer of the overall stock market. On January 31, 2006, 9 of the 30 stocks making up the DJIA increased in price (The Wall Street Journal, February 1, 2006). On the basis of this fact, a financial analyst claims we can assume that 30% of the stocks traded on the New York Stock Exchange (NYSE) went up the same day.A sample of 60 stocks traded on the NYSE that day showed that 24 went up.You are conducting a study to see if the proportion of stocks that went up is significantly more than 0.3. You use a significance level of α=0.001α=0.001.What is the test statistic for this sample? (Report answer accurate to three decimal places.)test statistic = What is the p-value for this sample? (Report answer accurate to four decimal places.)p-value =arrow_forward
- Many investors and financial analysts believe the Dow Jones Industrial Average (DJIA) gives a good barometer of the overall stock market. On January 31, 2006, 9 of the 30 stocks making up the DJIA increased in price (The Wall Street Journal, February 1, 2006). On the basis of this fact, a financial analyst claims we can assume that 30% of the stocks traded on the New York Stock Exchange (NYSE) went up the same day.A sample of 80 stocks traded on the NYSE that day showed that 11 went up.You are conducting a study to see if the proportion of stocks that went up is is significantly less than 0.3. You use a significance level of α=0.02α=0.02.What is the test statistic for this sample? (Report answer accurate to three decimal places.)test statistic = What is the p-value for this sample? (Report answer accurate to four decimal places.)p-value = The p-value is... less than (or equal to) αα greater than αα This test statistic leads to a decision to... reject the null accept the null fail…arrow_forwardMariah Jacobsen is the marketing manager at ABC Electronics, a major consumer electronics supplier in the northwest. Over the last five years, sales of the company's flagship product - the Wizer Anonymizer (the WA) - have been 45000, 45500, 44500, 46000 and 44000 units. This rate of sales is considered average for the product over the last twenty years or so. Ms. Jacobsen believes that the distribution of the WA's sales is normal with a standard deviation of 1500 units. If she were asked to make a forecast of next year's sales to upper management, what is the likelihood that she would be correct if she predicts sales between 43000 and 46000?arrow_forwardMany investors and financial analysts believe the Dow Jones Industrial Average (DJIA) gives a good barometer of the overall stock market. On January 31, 2006, 9 of the 30 stocks making up the DJIA increased in price (The Wall Street Journal, February 1, 2006). On the basis of this fact, a financial analyst claims we can assume that 30% of the stocks traded on the New York Stock Exchange (NYSE) went up the same day.A sample of 61 stocks traded on the NYSE that day showed that 30 went up.You are conducting a study to see if the proportion of stocks that went up is is significantly more than 0.3. You use a significance level of α=0.001α=0.001.What is the test statistic for this sample? (Report answer accurate to three decimal places.)test statistic = What is the p-value for this sample? (Report answer accurate to four decimal places.)p-value = The p-value is... less than (or equal to) αα greater than αα This test statistic leads to a decision to... reject the null accept the null…arrow_forward
- Many investors and financial analysts believe the Dow Jones Industrial Average (DJIA) gives a good barometer of the overall stock market. On January 31, 2006, 9 of the 30 stocks making up the DJIA increased in price (The Wall Street Journal, February 1, 2006). On the basis of this fact, a financial analyst claims we can assume that 30% of the stocks traded on the New York Stock Exchange (NYSE) went up the same day. A sample of 51 stocks traded on the NYSE that day showed that 22 went up. You are conducting a study to see if the proportion of stocks that went up is significantly more than 0.3. You use a significance level of a =0.05. = What is the test statistic for this sample? (Report answer accurate to three decimal places.) test statistic = What is the p-value for this sample? (Report answer accurate to four decimal places.) p-value = The p-value is... O less than (or equal to) a O greater than a This test statistic leads to a decision to... O reject the null O accept the null O…arrow_forwardMany investors and financial analysts believe the Dow Jones Industrial Average (DJIA) gives a good barometer of the overall stock market. On January 31, 2017, 9 of the 30 stocks making up the DJIA increased in price. On the basis of this fact, a financial analyst claims we can assume that 55% of the stocks traded on the New York Stock Exchange (NYSE) went up the same day. A sample of 79 stocks traded on the NYSE that day showed that 48 went up. You are conducting a study to see if the proportion of stocks that went up is significantly different from 55%. You use a significance level of a = 0.025. 1. For this study, we should use Select an answer 2. The null and alternative hypotheses would be: Ho:? v Select an answer v (please enter a decimal) Hi:? vSelect an answer v (Please enter a decimal) 3. The test statistic (please show your answer to 3 decimal places.) 4. The p-value = (Please show your answer to 4 decimal places.) 5. The p-value is ? va 6. Based on this, we should Select an…arrow_forwardMany investors and financial analysts believe the Dow Jones Industrial Average (DJIA) gives a good barometer of the overall stock market. On January 31, 2017, 9 of the 30 stocks making up the DJIA increased in price.On the basis of this fact, a financial analyst claims we can assume that 54% of the stocks traded on the New York Stock Exchange (NYSE) went up the same day. A sample of 74 stocks traded on the NYSE that day showed that 35 went up. You are conducting a study to see if the proportion of stocks that went up is significantly smaller than 54%. You use a significance level of α=0.05α=0.05. how to you come up with the test statistic and p value using excelarrow_forward
- The following table provides data on access to running water in the home for a certain developing country in 2006. Use the table to find answers to the questions. Have running water in the home Do not have running water in the home 100% People in Urban Areas 90% 78,359,000 3,265,000 People in Rural Areas 18,559,000 7,217,000 What percent of people in that country have running water in the house? Round answers to the nearest percent and include the % sign in your answer. Note that this is the number of the people that have running water (both in rural an urban areas) divided by the total number of people in the country (107,400,000). BZWarrow_forwardMany investors and financial analysts believe the Dow Jones Industrial Average (DJIA) gives a good barometer of the overall stock market. On January 31, 2006, 9 of the 30 stocks making up the DJIA increased in price (The Wall Street Journal, February 1, 2006). On the basis of this fact, a financial analyst claims we can assume that 30% of the stocks traded on the New York Stock Exchange (NYSE) went up the same day. A sample of 72 stocks traded on the NYSE that day showed that 24 went up. You are conducting a study to see if the proportion of stocks that went up is significantly more than 0.3. You use a significance level of a = 0.10. What is the test statistic for this sample? (Report answer accurate to three decimal places.) test statistic = What is the p-value for this sample? (Report answer accurate to four decimal places.) p-value = The p-value is... less than (or equal to) a greater than a This test statistic leads to a decision to... O reject the null accept the null O fail to…arrow_forwardThree businesswomen are trying to convene in Cincinnati for a business meeting. The first women (Woman 1) is arriving on a flight from Atlanta, the second (Woman 2) is arriving on a flight from Dallas, and the third (Woman 3) is arriving on a flight from Chicago. Historical data suggests that the Atlanta flight is “on time” 90% of the time, the Dallas flight is “on time” 95% of the time, and the Chicago flight is “on time” 80% of the time. Furthermore, historical data suggests that the three flights are independent with respect to on time behavior. Define the sample space for this random experiment. Compute the probability for each of the outcomes in the sample space. Let W denote the number of business women that arrive on time. Construct the probability mass function of W Construct the cumulative distribution function of W Find the expected value of W Compute the standard deviation of Warrow_forward
- MATLAB: An Introduction with ApplicationsStatisticsISBN:9781119256830Author:Amos GilatPublisher:John Wiley & Sons Inc
 Probability and Statistics for Engineering and th...StatisticsISBN:9781305251809Author:Jay L. DevorePublisher:Cengage Learning
 Statistics for The Behavioral Sciences (MindTap C...StatisticsISBN:9781305504912Author:Frederick J Gravetter, Larry B. WallnauPublisher:Cengage Learning
  Elementary Statistics: Picturing the World (7th E...StatisticsISBN:9780134683416Author:Ron Larson, Betsy FarberPublisher:PEARSON
 The Basic Practice of StatisticsStatisticsISBN:9781319042578Author:David S. Moore, William I. Notz, Michael A. FlignerPublisher:W. H. Freeman
 Introduction to the Practice of StatisticsStatisticsISBN:9781319013387Author:David S. Moore, George P. McCabe, Bruce A. CraigPublisher:W. H. Freeman