
MATLAB: An Introduction with Applications
6th Edition
ISBN: 9781119256830
Author: Amos Gilat
Publisher: John Wiley & Sons Inc
expand_more
expand_more
format_list_bulleted
Related questions
Question
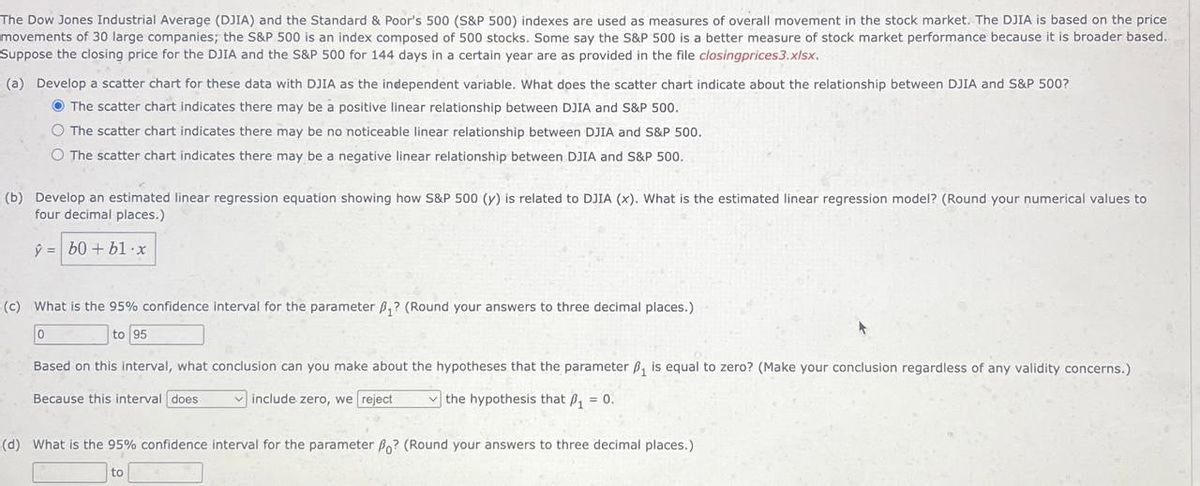

Transcribed Image Text:The Dow Jones Industrial Average (DJIA) and the Standard & Poor's 500 (S&P 500) indexes are used as measures of overall movement in the stock market. The DJIA is based on the price
movements of 30 large companies; the S&P 500 is an index composed of 500 stocks. Some say the S&P 500 is a better measure of stock market performance because it is broader based.
Suppose the closing price for the DJIA and the S&P 500 for 144 days in a certain year are as provided in the file closingprices3.xlsx.
(a) Develop a scatter chart for these data with DJIA as the independent variable. What does the scatter chart indicate about the relationship between DJIA and S&P 500?
The scatter chart indicates there may be a positive linear relationship between DJIA and S&P 500.
The scatter chart indicates there may be no noticeable linear relationship between DJIA and S&P 500.
The scatter chart indicates there may be a negative linear relationship between DJIA and S&P 500.
(b) Develop an estimated linear regression equation showing how S&P 500 (y) is related to DJIA (x). What is the estimated linear regression model? (Round your numerical values to
four decimal places.)
ŷ=b0+b1 x
(c) What is the 95% confidence interval for the parameter ₁? (Round your answers to three decimal places.)
0
to 95
Based on this interval, what conclusion can you make about the hypotheses that the parameter ₁ is equal to zero? (Make your conclusion regardless of any validity concerns.)
Because this interval does
include zero, we reject
the hypothesis that ₁ = 0.
(d) What is the 95% confidence interval for the parameter Bo? (Round your answers to three decimal places.)
to
Expert Solution
This question has been solved!
Explore an expertly crafted, step-by-step solution for a thorough understanding of key concepts.

Step by stepSolved in 2 steps

Knowledge Booster

Similar questions
- 2021 2020 2019 2018 2017 Sales $ 497,289 $ 327, 164 $ 267,073 $ 197, 102 $ 141,800 Cost of goods sold 251,145 165, 182 137, 037 99,651 70,900 Accounts receivable 23,969 19, 172 18,214 11,511 9,699 Compute trend percents for the above accounts, using 2017 as the base year.arrow_forward(3) Look at the boxplot below, which shows data for the selling price of homes in acertain neighborhood.a. What was the typical selling price? (This should be one number.)b. The cheapest 25% of homes sold for what range of prices? (This should be a rangeof values.) c. The middle 50% of homes sold for what range of prices? (Again, this should be arange of values.)arrow_forwardWalmart predicted the following end-of-year earnings from 2003 - 2012 in billions of dollars (9.5, 9.8, 10.2, 10.7, 10.5, 11.0, 12.1, 14.7, 16.3, 18.7). Their actual end-of- year earnings for the same years are as follows: 9.1, 9.2, 10.6, 10.3, 9.9, 10.4, 11.6, 11.8, 13.1, 22.7). In testing the claim that the mean predicted value is the same as the mean actual value, which p-value is correct? 0.228 0.456 0.779 0.05 4arrow_forward
- 5. Market share of electric vehicles rose from 1.13% in 2017 to 2.1% in 2018.(a) What is the increase in market share in percentage points?(b) What is the percent increase in market share?arrow_forwardThe table below shows the year open and year closing price of the S&P 500 Stock Index from 2005 to 2020: Year Year Open Year Close Annual Percent Change 2005 $ 1,202.08 $ 1,248.29 2006 $ 1,268.08 $ 1,418.30 2007 $ 1,416.60 $ 1,468.36 2008 $ 1,447.16 $ 903.25 2009 $ 931.80 $ 1,115.10 2010 $ 1,132.99 $ 1,257.64 2011 $ 1,271.87 $ 1,257.60 2012 $ 1,277.06 $ 1,426.19 2013 $ 1,462.42 $ 1,848.36 2014 $ 1,831.98 $ 2,058.90 2015 $ 2,058.20 $ 2,043.94 2016 $ 2,012.66 $ 2,238.83 2017 $ 2,257.83 $ 2,673.61 2018 $ 2,695.81 $ 2,506.85 2019 $ 2,510.03 $ 3,230.78 2020 $ 3,257.85 $ 3,756.07 Find the annual percent change for the S&P 500 from 2005 to 2020; (Put those values in the table above) Compute the mean,…arrow_forwardThe following information is taken from Johnson & Johnson's annual reports. Its common stock is listed on the New York Stock Exchange, using the symbol JNJ. Johnson & Johnson Domestic Sales International Sales Employees Year ($ million) ($ million) (thousands) 2010 $ 29,437 $ 32,124 114.0 2011 12,907 36,107 117.9 2012 29,830 37,394 127.6 2013 31,910 39,402 128.1 2014 34,782 39,548 126.5 2015 35,687 34,387 127.1 2016 37,811 34,079 126.4 2017 39,863 36,587 134.0 2018 41,884 39,697 135.1 Using the period 2010–12 as the base period, compute a simple index of international sales for each year from 2013 to 2018. (Round your answers to 1 decimal place.)The index (2010–2012 = 100) for selected years is:arrow_forward
- The Big Mac index is a way of measuring Purchasing Power Parity (PPP) between different countries. By diverting the average national Big Mac prices to U.S. dollars, the same goods can be informally compared. The Big Mac can also be a good indicator for the individual purchasing power of an economy since he exists worldwide in standard size, composition and quality. Price # of Countries Rel. f. Cum. f 1.50-1.99 2 2.00-2.49 4 2.50-2.99 7 3.00-3.49 9. 3.50-3.99 7 4.00-4.49 8 4.50-4.99 9 5.00-5.49 7 5.50-5.99 1 6.00-6.49 2 6.50-6.99 1 a. What is the statistical name of the table above? b. How many countries were sampled? c. State the class width. d. Calculate the mean and standard deviation of the average prices of a Big Mac worldwide. Attach correct symbols and units to your answers. Explain how you obtained your answers.arrow_forwardThe following table shows the price per share of Apple stock at the beginning of different months. Calculate the four-month weighted moving average for October 2021. Round your answer to the nearest cent. Month July 2021 August 2021 September 2021 October 2021 November 2021 December 2021 Apple Stock Price Simple Moving Average Weighted Moving Average $136.60 $146.36 $152.83 $141.90 $148.99 $167.48 ???arrow_forwardSuppose that a firm's sales were $3,750,000 five years ago and are $5,250,000 today. What was the geometric mean growth rate in sales over the past five years?arrow_forward
arrow_back_ios
arrow_forward_ios
Recommended textbooks for you
- MATLAB: An Introduction with ApplicationsStatisticsISBN:9781119256830Author:Amos GilatPublisher:John Wiley & Sons Inc
 Probability and Statistics for Engineering and th...StatisticsISBN:9781305251809Author:Jay L. DevorePublisher:Cengage Learning
 Statistics for The Behavioral Sciences (MindTap C...StatisticsISBN:9781305504912Author:Frederick J Gravetter, Larry B. WallnauPublisher:Cengage Learning
  Elementary Statistics: Picturing the World (7th E...StatisticsISBN:9780134683416Author:Ron Larson, Betsy FarberPublisher:PEARSON
 The Basic Practice of StatisticsStatisticsISBN:9781319042578Author:David S. Moore, William I. Notz, Michael A. FlignerPublisher:W. H. Freeman
 Introduction to the Practice of StatisticsStatisticsISBN:9781319013387Author:David S. Moore, George P. McCabe, Bruce A. CraigPublisher:W. H. Freeman
MATLAB: An Introduction with Applications
Statistics
ISBN:9781119256830
Author:Amos Gilat
Publisher:John Wiley & Sons Inc
Probability and Statistics for Engineering and th...
Statistics
ISBN:9781305251809
Author:Jay L. Devore
Publisher:Cengage Learning
Statistics for The Behavioral Sciences (MindTap C...
Statistics
ISBN:9781305504912
Author:Frederick J Gravetter, Larry B. Wallnau
Publisher:Cengage Learning
Elementary Statistics: Picturing the World (7th E...
Statistics
ISBN:9780134683416
Author:Ron Larson, Betsy Farber
Publisher:PEARSON
The Basic Practice of Statistics
Statistics
ISBN:9781319042578
Author:David S. Moore, William I. Notz, Michael A. Fligner
Publisher:W. H. Freeman
Introduction to the Practice of Statistics
Statistics
ISBN:9781319013387
Author:David S. Moore, George P. McCabe, Bruce A. Craig
Publisher:W. H. Freeman