
Practical Management Science
6th Edition
ISBN: 9781337406659
Author: WINSTON, Wayne L.
Publisher: Cengage,
expand_more
expand_more
format_list_bulleted
Related questions
Question
Please help me solve these using solver in excel

Transcribed Image Text:AutoSave OFF
PC...
Assignment 8.2
Tell me
✓
✓
BD
Share
Comments
✓
✓
Sort &
Filter
Find &
Select
Analyze
Data
Sensitivity
T
U
V
W
X
Y
Home Insert
Draw
Page Layout Formulas
Data
Review View
Automate
Calibri (Body)
✓
11
✓
Aˆ A
Wrap Text
General
✓
Insert ✓ Σ
Delete ▾
Paste
B I U
✓
✓
✓
Merge & Center
$
✓
%
0-
.00
Conditional Format Cell
Formatting as Table Styles
Format
M17
fx
B
C
D
E
F
G
H
|
J
K
L
M
N
O
P
0
R
S
A
1
2
3
4
5
6
7
8
9
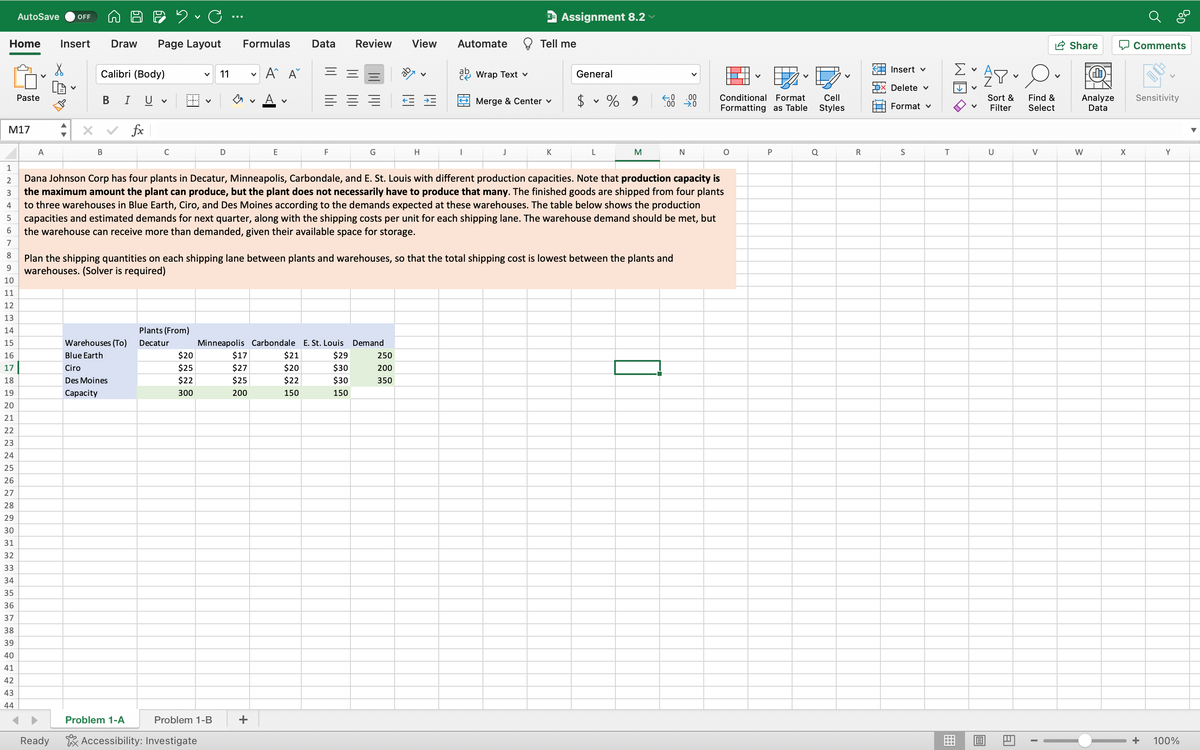
Dana Johnson Corp has four plants in Decatur, Minneapolis, Carbondale, and E. St. Louis with different production capacities. Note that production capacity is
the maximum amount the plant can produce, but the plant does not necessarily have to produce that many. The finished goods are shipped from four plants
to three warehouses in Blue Earth, Ciro, and Des Moines according to the demands expected at these warehouses. The table below shows the production
capacities and estimated demands for next quarter, along with the shipping costs per unit for each shipping lane. The warehouse demand should be met, but
the warehouse can receive more than demanded, given their available space for storage.
Plan the shipping quantities on each shipping lane between plants and warehouses, so that the total shipping cost is lowest between the plants and
warehouses. (Solver is required)
10
11
12
13
14
15
Warehouses (To)
Plants (From)
Decatur
Minneapolis Carbondale E. St. Louis Demand
16
Blue Earth
$20
$17
$21
$29
250
17
Ciro
$25
$27
$20
$30
200
18
Des Moines
$22
$25
$22
$30
350
19
Capacity
300
200
150
150
20
21
22
23
24
25
26
27
28
29
30
31
32
33
34
35
36
37
38
39
40
41
42
43
44
Ready
Problem 1-A
Problem 1-B
Accessibility: Investigate
+
A
+
100%

Transcribed Image Text:AutoSave OFF
PC...
Assignment 8.2
Tell me
Home Insert
Draw
Page Layout Formulas
Data Review View
Automate
Calibri (Body)
✓
11
✓
Aˆ A
Wrap Text
General
Paste
B
I U
✓
✓
✓
Merge & Center
$
✓
% 9
A1
fx
Insert ✓ Σ
✓
Delete ▾
.00
0-
Conditional Format
Formatting as Table
Cell
Styles
Format
A
B
C
D
E
F
G
H
J
K
L
M
N
1
2
(Continued from Problem 1-A) Dana Johnson Corp was just notified that
3
4
5
-- the estimated demands should be revised to: 250 units, 240 units, and 375 units for Blue Earth, Ciro and DesMoines, respectively (according to the new data from market research);
-- The production capacities at four plants provided in Problem 1-A are for regular-hour (i.e., regular-time, RT) production. Production using overtime (OT) hours will be available only at
the Decatur plant with OT production cost = $65 per unit and OT capacity = 40 units, and at the Minneapolis plant with OT production cost = $70 per unit and OT capacity = 50 units;
-- the shipment from Decatur to Des Moines will not be available next quarter due to disagreement over the contract between the management and the carrier.
6
7
8
9
10
11
The manager considers that in Problem 1-A, how you plan the shipping schedule will have an impact on not only the shipping quantities, but also next quarter's production at each plant.
So, he would like to evaluate shipping costs together with production costs when designing the plan. The table below shows the production cost per unit at each plant. The shipping
costs per unit for each shipping lane are provided already in Problem 1-A. As previously stated, the warehouse demands should be met, but the warehouse can receive more than
demanded, given their available space for storage.
Should OT prduction be considered in your plan? If your answer is yes, how can it be incorporated into the optimal plan where the total shipping and production cost is the lowest? You
need to create the template to use Solver. Then, summarize your plan into Tables 2 and 3 below.
$50
18 TABLE 1
20 Decatur
21 RT
26
28
30
36
38
40
46
48
50
121992222222222222≈≈≈33333327734444455
16
Production cost per unit
✓
✓
BD
Share
Comments
✓
✓
Sort &
Filter
Find &
Select
Analyze
Data
Sensitivity
P
Q
R
S
T
U
V
W
X
Y
Z
AA
TABLE 2
TABLE 3
E. St. Louis
Warehouses (To)
Shipping quantities for each shipping lane
Plants (From)
Decatur
Production RT/OT quantities at each plant
Minneapolis Carbondale E. St. Louis
Decatur
Minneapolis Carbondale
E. St. Louis
RT
Blue Earth
$70
$40
Ciro
RT
OT
Des Moines
Minneapolis Minneapolis Carbondale
Decatur
от
RT
$65
Ready
от
$60
RT
$70
Problem 1-A
Problem 1-B
Accessibility: Investigate
+
A
+
89%
Expert Solution
This question has been solved!
Explore an expertly crafted, step-by-step solution for a thorough understanding of key concepts.

Step by stepSolved in 2 steps

Knowledge Booster

Similar questions
- What is the answer in this number 4?arrow_forwardFind the prime factorization of 2014.arrow_forwardMillie wants to install a new carpet in the living room of her house. She calculated the square footage of the room and then multiplied it by a set cost factor to estimate the cost. This is an example of_________ Group of answer choices Parametric estimating Three-point estimating Bottom-up estimating Analogous estimatingarrow_forward
- apply appropriate techniques to solve a range of models of mathematical and real-world problems analyse the effects of changing model parameters on LP model predictions * select and develop appropriate mathematical models for decision making problems (a) A stationary supplies company wishes to produce deluxe and budget ink pens. Deluxe ink pens require eight units of material and 9 minutes to produce each pen. Budget ink pens require six units of material and 4 minutes to produce each pen. The company has 38.25 hours of labour and 1950 units of material available per week. Profit for deluxe ink pens is $2.40 per pen and for budget ink pens is $1.75 per pen. The company also wants the number of deluxe ink pens to be produced to be at least 6 times the number of budget ink pens produced. Formulate a Linear Programming problem to determine the company's best production plan to maximise profit (do not solve). (b) Solve the following Linear Programming problem using the Simplex Method. Full…arrow_forwardPlease do not give solution in image format thankuarrow_forwardHi, would you be able to help me with this question? Thanksarrow_forward
- Prove the following using strong induction. Suppose you are gifted a collection of 3n pokéballs; all of the the pokéballs have the same size and weight except for one which is slightly heavier, and otherwiselook and feel exactly the same as the others. You are tasked with identifying theheavy pokéball and have at your disposal a set of balancing scales which can be usedto compare the weights of two collections of pokéballs. The scales can show whetherthe two collections have the same weight, or can show which collection is heavier if theweights are different. Prove using strong induction that you can identify the heavypokéball out of 3n pokéballs using n weighing operations.arrow_forwardHelp pleasee 15) Mining Company operates two mines for the purpose of extracting gold and silver. The Saddle Mine costs $26,000/day to operate, and it yields 50 oz of gold and 3000 oz of silver each of x day. The Horseshoe Mine costs $16,000/day to operate, and it yields 75 oz of gold and 1000 oz of silver each of y day. Company management has set a target of at least 650 oz of gold and 18,000 oz of silver. (a) How many days should each mine be operated so that the target can be met at a minimum cost?The minimum is C = at (x, y) = Suppose C = cx + 16,000y. Find the range of values that the Saddle Mine's daily operating cost, the coefficient c of x, can assume without changing the optimal solution.≤ CI Find the range of values that the requirement for gold can assume.≤ (requirement for gold) ≤ Find the shadow price for the requirement for gold. (Round your answer to the nearest cent.)arrow_forwardFind the prime factorization of 92169.arrow_forward
- Please note that formulating linear program doesn't need coding but only modelling. It's operational Research problem. Garden House produces three custom flower seed mixes. Garden House is trying to decide how many pounds of each mix to produce for the upcoming planting season. All three mixes require two seed types, the all-star and the purple power. Garden house can obtain at most 25 lbs of all-star and 30 lbs of purple power seeds. Seed requirements, along with the revenue per pound of each, are given in Table 1, All star seeds cost $2/lb, and purple power seeds cost $3/lb. From past history, the company knows that it will be able to sell at most 60 lbs of mix A, but that they will sell as much of mix B and mix C as they produce. Formulate a linear program to help garden house maximize its profits.arrow_forwardExample 5: Find lim Solution // lim X-X x 2 + 2 = lim X-X (x+2) x→∞ √√x²+1) X-X x + 0 0 11 1+arrow_forwardLong-Life Insurance has developed a linear model that it uses to determine the amount of term life insurance a family of four should have, based on the current age of the head of the household. The equation is:y = 850 − .1xwherey = Insurance needed ($000)x = Current age of head of household a. Plot the relationship on a graph. b. Use the equation to determine the amount of term life insurance to recommend for a family of four if the head of the household is 30 years old.arrow_forward
arrow_back_ios
SEE MORE QUESTIONS
arrow_forward_ios
Recommended textbooks for you
- Practical Management ScienceOperations ManagementISBN:9781337406659Author:WINSTON, Wayne L.Publisher:Cengage,
 Operations ManagementOperations ManagementISBN:9781259667473Author:William J StevensonPublisher:McGraw-Hill Education
 Operations and Supply Chain Management (Mcgraw-hi...Operations ManagementISBN:9781259666100Author:F. Robert Jacobs, Richard B ChasePublisher:McGraw-Hill Education
 Purchasing and Supply Chain ManagementOperations ManagementISBN:9781285869681Author:Robert M. Monczka, Robert B. Handfield, Larry C. Giunipero, James L. PattersonPublisher:Cengage Learning
 Production and Operations Analysis, Seventh Editi...Operations ManagementISBN:9781478623069Author:Steven Nahmias, Tava Lennon OlsenPublisher:Waveland Press, Inc.
Practical Management Science
Operations Management
ISBN:9781337406659
Author:WINSTON, Wayne L.
Publisher:Cengage,
Operations Management
Operations Management
ISBN:9781259667473
Author:William J Stevenson
Publisher:McGraw-Hill Education
Operations and Supply Chain Management (Mcgraw-hi...
Operations Management
ISBN:9781259666100
Author:F. Robert Jacobs, Richard B Chase
Publisher:McGraw-Hill Education
Purchasing and Supply Chain Management
Operations Management
ISBN:9781285869681
Author:Robert M. Monczka, Robert B. Handfield, Larry C. Giunipero, James L. Patterson
Publisher:Cengage Learning
Production and Operations Analysis, Seventh Editi...
Operations Management
ISBN:9781478623069
Author:Steven Nahmias, Tava Lennon Olsen
Publisher:Waveland Press, Inc.