
MATLAB: An Introduction with Applications
6th Edition
ISBN: 9781119256830
Author: Amos Gilat
Publisher: John Wiley & Sons Inc
expand_more
expand_more
format_list_bulleted
Related questions
Concept explainers
Topic Video
Question

Transcribed Image Text:1
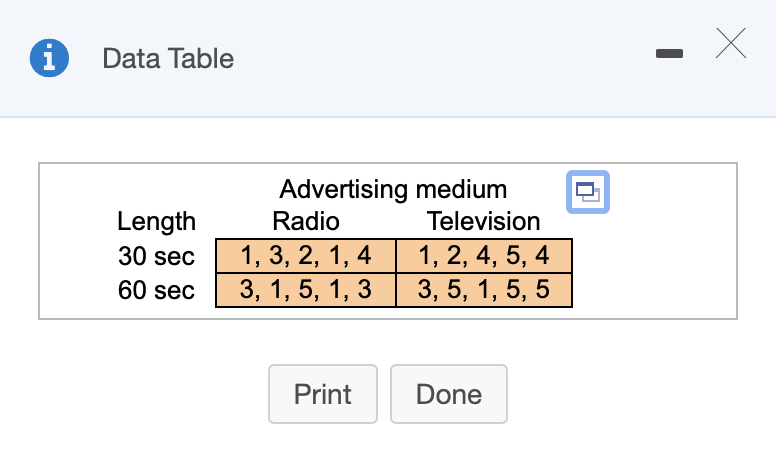
Data Table
Advertising medium
Radio
Length
Television
1, 3, 2, 1, 4
3, 1, 5, 1, 3
30 sec
1, 2, 4, 5, 4
60 sec
3, 5, 1, 5, 5
Print
Done

Transcribed Image Text:In a study, a random sample of 20 adults rated the effectiveness of advertisements. Each adult rated an advertisement that lasted 30 or 60 seconds. The block design in the
accompanying table shows these ratings (on a scale of 1 to 5, with 5 being extremely effective). Use a = 0.05 and a technology tool and the given block design to perform a
two-way ANOVA test.
Click the icon to view the block design and ratings.
Determine the null and alternative hypotheses for the main effects. Select all that apply.
O A. Ho: The length of the ad has no effect on the rating.
B. Ho: The rating has no effect on the advertising medium.
Ha: The rating has an effect on the advertising medium.
Ha: The length of the ad has an effect on the rating.
O c. Ho: The advertising medium has no effect on the rating.
D. Ho:
: The advertising medium has no effect on the length of the ad.
Ha: The advertising medium has an effect on the rating.
: The advertising medium has an effect on the length of the ad.
Ha:
length of the ad.
: The rating has an effect on the length of the ad.
E. Ho: The rating has no effect on
Ho: The length
no effect on
advertising medium.
ac
На
H: The length of the ad has an effect on the advertising medium.
Expert Solution
This question has been solved!
Explore an expertly crafted, step-by-step solution for a thorough understanding of key concepts.

This is a popular solution

Trending nowThis is a popular solution!

Step by stepSolved in 3 steps

Knowledge Booster


Learn more about
Need a deep-dive on the concept behind this application? Look no further. Learn more about this topic, statistics and related others by exploring similar questions and additional content below.Similar questions
- Cola Weights For the analysis of variance test described in Exercise 1, is that test left-tailed, right-tailed, or two-tailed?arrow_forwardTrying to figure out conclusion regarding hypothesisarrow_forwardtion 14 of 23 > Attempt 2 In 2017, the entire fleet of light-duty vehicles sold in the United States by each manufacturer must emit an average of no more than 84 milligrams per mile (mg/mi) of nitrogen oxides (NOX) and nonmethane organic gas (NMOG) over the useful life (150,000 miles of driving) of the vehicle. NOX + NMOG emissions over the useful life for one car model vary Normally with mean 78 mg/mi and standard deviation 6 mg/mi. (a) What is the probability that a single car of this model emits more than 84 mg/mi of NOX + NMOG? (Enter your answer rounded to four decimal places.) probability: (b) A company has 36 cars of this model in its fleet. What is the probability that the average NOX + NMOG level i of Publisher: W.H. Freeman Question Source: Moore, The Basic Practice Of Statistics, 8e contact us helo 6:45 PM ferms of use 中岁 11/7/2020 ギメ (2, Chp prt sc insert f12 f10 f9arrow_forward
- Correlation errors Your Economics instructor assignsyour class to investigate factors associated with the gross domestic product (GDP) of nations. Each student exam-ines a different factor (such as Life Expectancy, Literacy Rate, etc.) for a few countries and reports to the class.Apparently, some of your classmates do not understandStatistics very well because you know several of theirconclusions are incorrect. Explain the mistakes in theirstatements below.a) “My very low correlation of -0.772 shows that thereis almost no association between GDP and InfantMortality Rate.”b) “There was a correlation of 0.44 between GDP andContinent.”arrow_forwardClaim: The mean systolic blood pressure of all healthy adults is less than 122 mm Hg. Sample data: For 269 healthy adults, the mean systolic blood pressure level is 121.74 mm Hg and the standard deviation is 15.02 mm Hg. Complete parts (a) and (b). a. Express the original claim in symbolic form. Let the parameter represent a value with respect to systolic blood pressure of a healthy adult.arrow_forwardcorrelation coefficient of 0-42. Is it likely that the variables in the population are uncorrelated ? 49-18. A random sample of 27 pairs of observations from a normal population gives aarrow_forward
- Define Matrix Representations of OLS Regression Statistics?arrow_forwardThe average annual incidence rate per 100,000 of pancreatic cancer, (age adjusted to the 2000 US standard population) from 2012-2016 in Nevada was 11.3 per 100,000 population what do this meanarrow_forwardModule 5: Ihd Use the table of values and the expected frequencies to calculate the residual values and the chi square test statistic X XYZ A 34 44 22 B 19 53 32 Expected Frequencies A 25.98 47.549 26.471 B 27.02 49.451 27.529 Residual Values (Row i and column j) Chi Square Test Statistic (0.,, – E. ) E (0 – E) x =E E Round all values to 3 decimal places Y B The Chi Square Test Statistic x =arrow_forward
- Pearson correlation statistic is only valid when the relationship between the two quantitative (continuous) variables isarrow_forwardThe value of the ___________ is used to estimate the value of the population parameter.arrow_forwardCoom O Launch Meeting Zoom O Launch Meeting Zoom Check Your Understanding Die x 711f0308264d0cbd87b76a#screenldx=D2 ng High intracranial pressure (inside the skull) typically is a a. How many false positives were there among these 189 people? Explain the meaning of a false positive for the person tested. result of an injury to the head and can be very dangerous. A screening test for high intracranial pressure was proposed many years ago, based on the data in the following observations. This simple and non-invasive test involves observing the retinal vein to see if it is pulsating. Pulsation is normal and so would be considered a negative test result. Pulsation Absent Pulsation Present Total (Positive Test) (Negative Test) High Intracranial Pressure (Condition Present) Normal Intracranial Pressure b. How many false negatives were there? Explain the meaning of a false negative for the person tested. 43 43 (Condition Absent) 18 128 146 Total 61 128 189 Sources: B.E Levin, "The Clinical…arrow_forward
arrow_back_ios
SEE MORE QUESTIONS
arrow_forward_ios
Recommended textbooks for you
- MATLAB: An Introduction with ApplicationsStatisticsISBN:9781119256830Author:Amos GilatPublisher:John Wiley & Sons Inc
 Probability and Statistics for Engineering and th...StatisticsISBN:9781305251809Author:Jay L. DevorePublisher:Cengage Learning
 Statistics for The Behavioral Sciences (MindTap C...StatisticsISBN:9781305504912Author:Frederick J Gravetter, Larry B. WallnauPublisher:Cengage Learning
  Elementary Statistics: Picturing the World (7th E...StatisticsISBN:9780134683416Author:Ron Larson, Betsy FarberPublisher:PEARSON
 The Basic Practice of StatisticsStatisticsISBN:9781319042578Author:David S. Moore, William I. Notz, Michael A. FlignerPublisher:W. H. Freeman
 Introduction to the Practice of StatisticsStatisticsISBN:9781319013387Author:David S. Moore, George P. McCabe, Bruce A. CraigPublisher:W. H. Freeman
MATLAB: An Introduction with Applications
Statistics
ISBN:9781119256830
Author:Amos Gilat
Publisher:John Wiley & Sons Inc
Probability and Statistics for Engineering and th...
Statistics
ISBN:9781305251809
Author:Jay L. Devore
Publisher:Cengage Learning
Statistics for The Behavioral Sciences (MindTap C...
Statistics
ISBN:9781305504912
Author:Frederick J Gravetter, Larry B. Wallnau
Publisher:Cengage Learning
Elementary Statistics: Picturing the World (7th E...
Statistics
ISBN:9780134683416
Author:Ron Larson, Betsy Farber
Publisher:PEARSON
The Basic Practice of Statistics
Statistics
ISBN:9781319042578
Author:David S. Moore, William I. Notz, Michael A. Fligner
Publisher:W. H. Freeman
Introduction to the Practice of Statistics
Statistics
ISBN:9781319013387
Author:David S. Moore, George P. McCabe, Bruce A. Craig
Publisher:W. H. Freeman