
MACROECONOMICS FOR TODAY
10th Edition
ISBN: 9781337613057
Author: Tucker
Publisher: CENGAGE L
expand_more
expand_more
format_list_bulleted
Related questions
Question
not use ai please don't
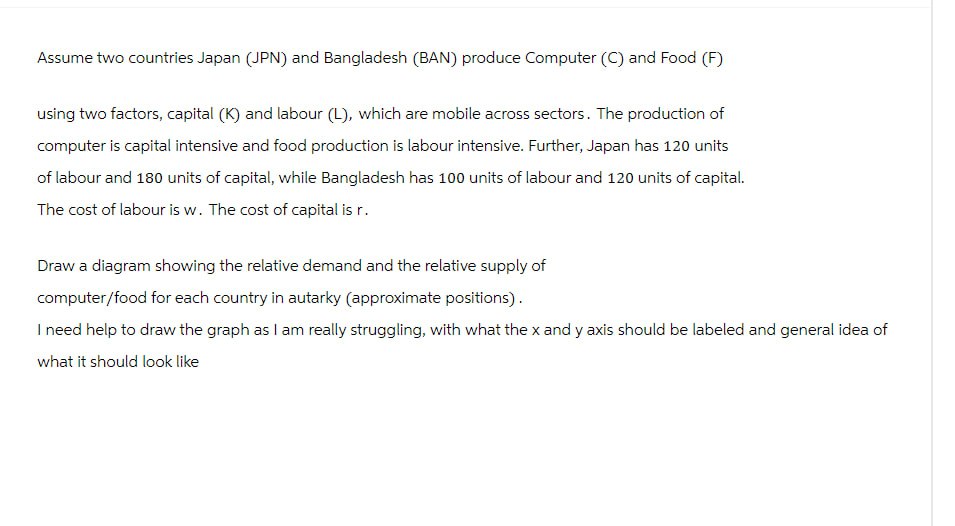

Transcribed Image Text:Assume two countries Japan (JPN) and Bangladesh (BAN) produce Computer (C) and Food (F)
using two factors, capital (K) and labour (L), which are mobile across sectors. The production of
computer is capital intensive and food production is labour intensive. Further, Japan has 120 units
of labour and 180 units of capital, while Bangladesh has 100 units of labour and 120 units of capital.
The cost of labour is w. The cost of capital is r.
Draw a diagram showing the relative demand and the relative supply of
computer/food for each country in autarky (approximate positions).
I need help to draw the graph as I am really struggling, with what the x and y axis should be labeled and general idea of
what it should look like
Expert Solution
This question has been solved!
Explore an expertly crafted, step-by-step solution for a thorough understanding of key concepts.

Step by stepSolved in 1 steps with 1 images

Knowledge Booster

Similar questions
- Suppose country A has 5000 units of capital and 2000 units of labor while country B has 1000 units of capital and 3000 units of labor: Which country is capital abundant and which one is labor abundant?arrow_forwardAssuming that there are only two countries in the world, Indonesia and ROW (Rest of the World) which both produce Cloth (C) and Food (F) using labor as factor production. The following table shows the number of hours of work needed to produce one unit of C and F in both countries: Cloth (C) Food (F) Indonesia 1 hour per meter 2 hour per kg ROW 6 hour per meter 3 hour per kgarrow_forward(Parts a-c) Assume two countries, Gisslovia and Gerardania, both have 1200 units of labor that can be used to produce food or clothing. In Gisslovia it takes 4 units of labor to produce one unit of food and 3 units of labor to produce one unit of clothing. In Geradania it takes 3 units of labor to produce one unit of food and 2 units of labor to produce one unit of clothing. a) If each country allocated one-half of its labor to food production how much food would be produced? b) If each country allocated one-half of its labor to clothing production how much clothing would be produced? c) Suppose Gisslovia only produced food. If Gerardania produced enough food to keep the total amount equal to part a, how much clothing would they produce?arrow_forward
- There are two countries, Atlantis and Thule, and two goods, Clothing (C) and food (F) In Atlantis, it takes 3 units of labour to produce a unit of Clothing and 3 units of labour to make a unit of Food. In Thule, a unit of Clothing requires 2 units of labour, and a unit of Food requires 5 units of labour. Assume that Atlantis has 300 units of labour, and Thule has 500 units of labour. (a) What is the opportunity cost of Food in terms of Clothing in each country? (b) Which country has an absolute advantage in which good? (c) Which country has a comparative advantage in which good? Why? (d) Draw the production possibilities frontier for each country (put Food on the horizontal axis). Label axes and slopes. (e) Draw the world production possibilities frontier (assuming labour does not move between countries). Again, put Food on the horizontal axis. Label axes and important points on - 2 - the diagram. (f ) Draw the world relative supply curve (labelled RS) for F/C with the relative price…arrow_forwardSuppose country A has 5000 units of capital and 2000 units of labor while country B has 6000 units of capital and 3000 units of labor. which country capital abundant.arrow_forwardWhat is the viewpoint of Ricardo regarding the Comparative Difference in Costs?arrow_forward
- Z and S.A are trading partners. Both produce metal ores (including lithium) and delivery trucks. Now suppose that if Zimbabwe uses all of its resources, it can produce 50,000 tons of metal ores or 100,000 delivery trucks (trading off at a constant rate). Suppose that if South Africa uses all of its resources, it can produce 20,000 tons of metal ores or 80,000 delivery trucks (trading off at a constant rate). What is the direction of the trade (who exports what to whom)? Be sure to give the opportunity costs of production of both goods for both countries.arrow_forwardPlease examine the data describing unit labor requirements and labor productivity for two nations. These nations are only able to produce one of two items - ships and planes. Given this information, what is the value of the cell labeled B? Unit Labor Requirements Hours of labor required to produce one unit Inland Ships Planes 2 Harborton 4 1 0.5 Labor Productivity How many units can be produced in one hour Inland Harborton Ships A 0.25 Planes 1.0 B 2 units 1 unit 0.5 units O unitsarrow_forwardSuppose that a worker in Country A can produce either 6 units of corn or 2 units of wheat per year, and a worker in Country B can produce either 2 units of corn or 6 units of wheat per year. Each nation has 10 workers. Without trade, Country A produces and consumes 30 units of corn and 10 units of wheat per year. Country B produces and consumes 10 units of corn and 30 units of wheat. Suppose that trade is then initiated between the two countries, and Country A sends 30 units of corn to Country B in exchange for 30 units of wheat. Country A will now be able to consume a maximum of Select one: a.30 units of corn and 30 units of wheat. b.40 units of corn and 20 units of wheat. c.40 units of corn and 30 units of wheat. d.10 units of corn and 40 units of wheat.arrow_forward
- If Q = 0.5 K² L², and we use 2 units of capital and 2 units of labour, how much can we produce? (Only enter the number, no units or symbols.)arrow_forwardConsider a country where per capita GDP (Y/L) is 1/4 of the one in the US and the capital per worker (K/L) is 1/8 of the one in the US. According to the production model from the lecture (with Cobb-Douglas production function and capital share equal to 1/3) the country's TFP relative to US TFP is equal to 1/2 2 1/32 1/4arrow_forward2arrow_forward
arrow_back_ios
SEE MORE QUESTIONS
arrow_forward_ios
Recommended textbooks for you


 Economics Today and Tomorrow, Student EditionEconomicsISBN:9780078747663Author:McGraw-HillPublisher:Glencoe/McGraw-Hill School Pub Co
Economics Today and Tomorrow, Student Edition
Economics
ISBN:9780078747663
Author:McGraw-Hill
Publisher:Glencoe/McGraw-Hill School Pub Co