
MATLAB: An Introduction with Applications
6th Edition
ISBN: 9781119256830
Author: Amos Gilat
Publisher: John Wiley & Sons Inc
expand_more
expand_more
format_list_bulleted
Related questions
Question
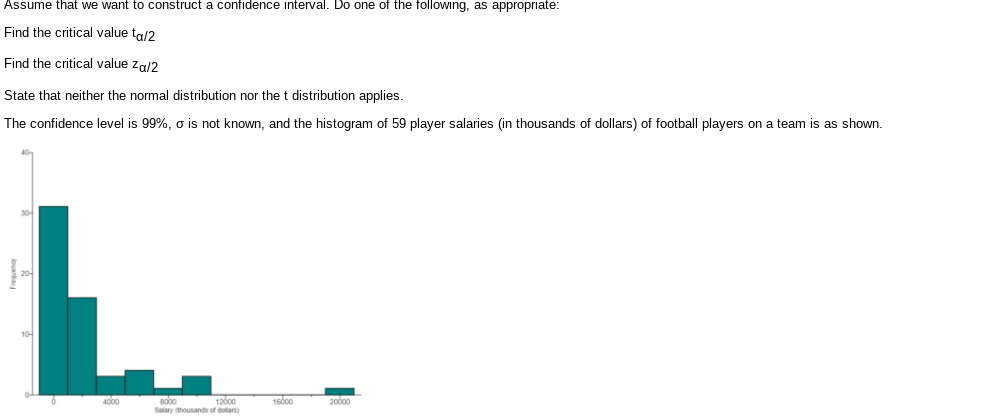

Transcribed Image Text:Assume that we want to construct a confidence interval. Do one of the following, as appropriate:
- Find the critical value \( t_{\alpha/2} \)
- Find the critical value \( z_{\alpha/2} \)
- State that neither the normal distribution nor the t distribution applies.
The confidence level is 99%, \(\sigma\) is not known, and the histogram of 59 player salaries (in thousands of dollars) of football players on a team is as shown.
**Histogram Description:**
- The horizontal axis represents salary (in thousands of dollars).
- The vertical axis represents frequency.
- There is a bar between $0 and $2000 with a frequency of around 35.
- There is a bar between $2000 and $4000 with a frequency of around 15.
- Smaller bars are present between $4000 and $6000, $6000 and $8000, $8000 and $10000, and $10000 and $12000 with lower frequencies.
- There is a single bar between $20000 and $22000 with a frequency of 1, indicating an outlier.
Expert Solution
This question has been solved!
Explore an expertly crafted, step-by-step solution for a thorough understanding of key concepts.

This is a popular solution

Trending nowThis is a popular solution!

Step by stepSolved in 3 steps with 3 images

Knowledge Booster

Similar questions
- If n = 15, ¯xx¯ = 36, and s = 12, construct a confidence interval at a 90% confidence level. Assume the data came from a normally distributed population. Give your answers to three decimal places.arrow_forwardTina catches a 14-pound bass. She does not know the population mean or standard deviation. So she takes a sample of five friends and they say the last bass they caught was 9, 12, 13, 10, and 10 pounds. Find the t and calculate a 95% (α = .05) confidence interval.arrow_forwardIf [0.64, 0.82] is a confidence interval for the population proportion. Find the value of the point estimator of the population proportion. Select one: O a. 0.73 O b. 0.70 O c. 0.74 O d. 0.72arrow_forward
- The heart rates for a group of 17 students taking a final exam are given below. Assume heart rates are normally distributed. Use a TI-83, TI-83 plus, or TI-84 calculator to find the 95% confidence interval for the true population mean. Round your answers to two decimal places and use increasing order. Beats per minute 92 101 93 89 93 89 92 95 86 93 96 93 96 87 94 97 101arrow_forwardA statistics practitioner took a random sample of 55 observations from a population whose standard deviation is 28 and computed the sample mean to be 110. Note: For each confidence interval, enter your answer in the form (LCL, UCL). You must include the parentheses and the comma between the confidence limits. A. Estimate the population mean with 95% confidence. Confidence Interval =| B. Estimate the population mean with 90% confidence. Confidence Interval = C. Estimate the population mean with 99% confidence. Confidence Interval =arrow_forwardIf n = 110 and X = 88, construct a 99% confidence interval for the population proportion, p.Give your answers to three decimals < p <arrow_forward
arrow_back_ios
arrow_forward_ios
Recommended textbooks for you
- MATLAB: An Introduction with ApplicationsStatisticsISBN:9781119256830Author:Amos GilatPublisher:John Wiley & Sons Inc
 Probability and Statistics for Engineering and th...StatisticsISBN:9781305251809Author:Jay L. DevorePublisher:Cengage Learning
 Statistics for The Behavioral Sciences (MindTap C...StatisticsISBN:9781305504912Author:Frederick J Gravetter, Larry B. WallnauPublisher:Cengage Learning
  Elementary Statistics: Picturing the World (7th E...StatisticsISBN:9780134683416Author:Ron Larson, Betsy FarberPublisher:PEARSON
 The Basic Practice of StatisticsStatisticsISBN:9781319042578Author:David S. Moore, William I. Notz, Michael A. FlignerPublisher:W. H. Freeman
 Introduction to the Practice of StatisticsStatisticsISBN:9781319013387Author:David S. Moore, George P. McCabe, Bruce A. CraigPublisher:W. H. Freeman
MATLAB: An Introduction with Applications
Statistics
ISBN:9781119256830
Author:Amos Gilat
Publisher:John Wiley & Sons Inc
Probability and Statistics for Engineering and th...
Statistics
ISBN:9781305251809
Author:Jay L. Devore
Publisher:Cengage Learning
Statistics for The Behavioral Sciences (MindTap C...
Statistics
ISBN:9781305504912
Author:Frederick J Gravetter, Larry B. Wallnau
Publisher:Cengage Learning
Elementary Statistics: Picturing the World (7th E...
Statistics
ISBN:9780134683416
Author:Ron Larson, Betsy Farber
Publisher:PEARSON
The Basic Practice of Statistics
Statistics
ISBN:9781319042578
Author:David S. Moore, William I. Notz, Michael A. Fligner
Publisher:W. H. Freeman
Introduction to the Practice of Statistics
Statistics
ISBN:9781319013387
Author:David S. Moore, George P. McCabe, Bruce A. Craig
Publisher:W. H. Freeman