
MATLAB: An Introduction with Applications
6th Edition
ISBN: 9781119256830
Author: Amos Gilat
Publisher: John Wiley & Sons Inc
expand_more
expand_more
format_list_bulleted
Related questions
Concept explainers
Question
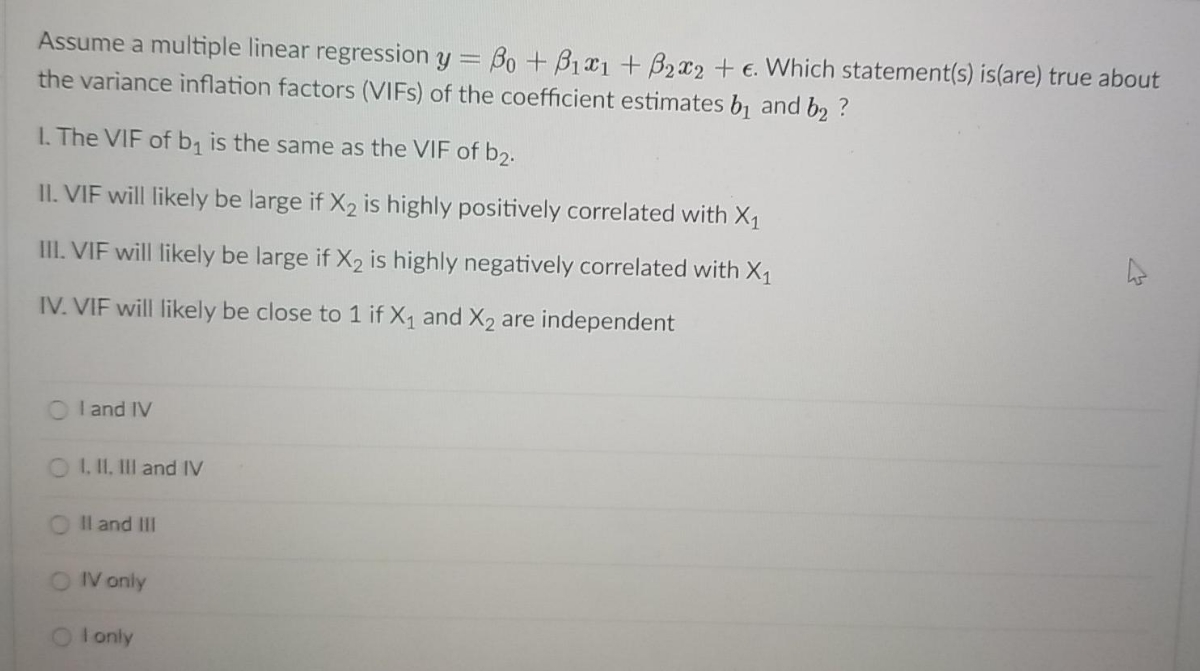

Transcribed Image Text:Assume a multiple linear regression y = Bo + B1 a1+ B2x2 + e. Which statement(s) is(are) true about
the variance inflation factors (VIFS) of the coefficient estimates b1 and b2 ?
I. The VIF of b, is the same as the VIF of b2.
II. VIF will likely be large if X2 is highly positively correlated with X1
II. VIF will likely be large if X2 is highly negatively correlated with X1
IV. VIF will likely be close to 1 if X1 and X2 are independent
O l and IV
1, II, III and IV
Il and III
OIV only
I only
Expert Solution
This question has been solved!
Explore an expertly crafted, step-by-step solution for a thorough understanding of key concepts.

Step by stepSolved in 2 steps

Knowledge Booster


Learn more about
Need a deep-dive on the concept behind this application? Look no further. Learn more about this topic, statistics and related others by exploring similar questions and additional content below.Similar questions
- What is the equation of the least square regression line for predicting the swimming speed of a beluga whale from its tail-beat frequency.arrow_forwardYou estimated a single regression relating the annual bonus given to employees of big corporations to the age of those employees. Your simple regression shows a positive value for the slope coefficient. You are absolutely convinced that the true effect of age on bonus amount is negative, so you think you have an omitted variable bias. If you are correct, which of the following is true about the omitted variable? There is some (omitted) variable that positively affects bonus amount and that is positively correlated with age. There is some (omitted) variable that negatively affects bonus amount and that is completely uncorrelated with age. There is some (omitted) variable that positively affects bonus amount and that is negatively correlated with age. There is some (omitted) variable that positively affects bonus amount and that is completely uncorrelated with age.arrow_forwardThe least-squares regression equation is y=784.6x+12,431 where y is the median income and x is the percentage of 25 years and older with at least a bachelor's degree in the region. The scatter diagram indicates a linear relation between the two variables with a correlation coefficient of 0.7962. Predict the median income of a region in which 25% of adults 25 years and older have at least a bachelor's degree.arrow_forward
- According to the nutrition research, recommendation on the consumption of fiber for children and teenagers is the following ( y is the amount of fiber per day (in grams), x is the age): y 21 24 26 28 29 33 | 38 43 44 2 4 6 8 10 12| 14 16 | 18 X 0.1. Can you conclude that the model specifies a (a) Test for the significance of regression using the analysis of variance with a = useful linear relationship between these two variables? We conclude that the model specifies a useful linear relationship at a = 0.1. (b) Estimate o?. Round your answer to three decimal places (e.g. 98.765). 2 %D (c) Estimate the standard error of the slope and intercept in this model. Round your answers to three decimal places (e.g. 98.765). se( B1) i se( B o) = iarrow_forwardThe least-squares regression line relating two statistical variables is given as = 24 + 5x. Compute the residual if the actual (observed) value for y is 38 when x is 2. 4 38 2arrow_forward4. The following regression is fitted using variables identified that could be related to tuition charges ($) of a university. TUITION = a+ B ACCEPT + y MSAT + 1 VSAT Where ACCEPT = the percentage of applicants that was accepted by the university, MSAT = Median Math SAT score for the freshman class and VSAT = Median English SAT score for the freshman class. The data was processed using MNITAB and the following is an extract of the output obtained: Predictor Coef StDev T P Constant -26780 6115 -4.38 0.000 ACCEPT 116.00 37.17 * 0.003 MSAT -4.21 14.12 VSAT 70.85 15.77 -0.30 4.49 0.767 ** S = 2685 R-Sq = 69.6% Analysis of Variance R-Sq (adj) = 67.7% Source DF SS MS F P Regression 3 808139371 Residual Error 49 353193051 269379790 7208021 37.37 0.000 Total 52 1161332421 a) Write out the regression equation. b) State the dependent and independent variable(s) c) Fill in the blanks identified by ** and ****. d) Is B significant, at the 10% level of significance? e) State one limitation of using…arrow_forward
- uppose IQ scores were obtained from randomly selected couplescouples. For 2020 such pairs of people, the linear correlation coefficient is 0.8900.890 and the equation of the regression line is ModifyingAbove y with caret equals negative 0.74 plus 1.02 xy=−0.74+1.02x, where x represents the IQ score of the husbandhusband. Also, the 2020 x values have a mean of 101.17101.17 and the 2020 y values have a mean of 102.7102.7. What is the best predicted IQ of the wifewife, given that the husbandhusband has an IQ of 9999? Use a significance level of 0.05. The best predicted IQ of the wifewife is nothing. (Round to two decimal places as needed.arrow_forwardThe following sample contains the scores of 6 students selected at random in Mathematics and English. Use the scores in English as the dependent variable Y. Mathematics score (X) 70 92 80 74 65 83 English score (Y) 74 84 63 87 78 90 ∑x=464, ∑y=476,∑x^2=36354,∑y^2=38254, ∑xy=36926. Estimate the regression parameters and also write the prediction equation.arrow_forwardThe fish in my pond have mean length 10 inches and mean weight 4 pounds. The correlation coefficient of length and weight is .9. If the length of a particular randomly selected fish is reported to be 10 inches, then what should we predict for the weight of that fish using simple linear regression? 4 10 2.5 NOT ENOUGH INFORMATION GIVEN NONE OF THE OTHERSarrow_forward
- Suppose that you have estimated coefficients for the regression model Y = B₁ + B₁X₁ + ß2X2 + ß3X3. Test the hypothesis that all three of the predictor variables are equal to 0, given the analysis of variance shown on the right. Use α = 0.05. Click here to view page 1 of a table of critical values of F. Click here to view page 2 of a table of critical values of F. Choose the correct null and alternartive hypotheses below. A. Ho: B₁ B₂ =B3 = 0 H₁: at least one ß; #0 C. Ho: B₁ B₂ = 3 = 0 H₁: B₁0, B₂0, B3 > 0 Find the critical value. The critical value is (Round to two decimal places as needed.) Source Regression Residual Error DF SS 3 9,654 23 2,400 B. Hō: at least one ß; ‡0 H₁: B₁ =B₂ =B3 = 0 D. H₁: B₁ = P₂ = ³3 = 0 H₁: B₁ B₂ B3 0 MSarrow_forwardSchool administrators wondered whether class size and grade achievement (in percent) were related. A random sample of classes revealed the following data. Number 10 8. 20 18 6. of Students 15 Average Grades 85 90 82 80 84 92 (%) 1. Calculate the linear correlation coefficient (Rc all answers to TWO decimal places) 2. Calculate the coefficient of determination (Rou all answers to TWO decimal places) 3.The linear regression equation is ASUS VivOBookarrow_forwardA researcher developed a regression model to predict the tear rating of a bag of coffee based on the plate gap in bag-sealing equipment. Data were collected on 28 bags in which the plate gap was varied. An analysis of variance from the regression showed that b, = 0.7909 and Sp. = 0.2294. a. At the 0.05 level of significance, is there evidence of a linear relationship between the plate gap of the bag-sealing machine and the tear rating of a bag of coffee? b. Construct a 95% confidence interval estimate of the population slope, B1. .....arrow_forward
arrow_back_ios
SEE MORE QUESTIONS
arrow_forward_ios
Recommended textbooks for you
- MATLAB: An Introduction with ApplicationsStatisticsISBN:9781119256830Author:Amos GilatPublisher:John Wiley & Sons Inc
 Probability and Statistics for Engineering and th...StatisticsISBN:9781305251809Author:Jay L. DevorePublisher:Cengage Learning
 Statistics for The Behavioral Sciences (MindTap C...StatisticsISBN:9781305504912Author:Frederick J Gravetter, Larry B. WallnauPublisher:Cengage Learning
  Elementary Statistics: Picturing the World (7th E...StatisticsISBN:9780134683416Author:Ron Larson, Betsy FarberPublisher:PEARSON
 The Basic Practice of StatisticsStatisticsISBN:9781319042578Author:David S. Moore, William I. Notz, Michael A. FlignerPublisher:W. H. Freeman
 Introduction to the Practice of StatisticsStatisticsISBN:9781319013387Author:David S. Moore, George P. McCabe, Bruce A. CraigPublisher:W. H. Freeman
MATLAB: An Introduction with Applications
Statistics
ISBN:9781119256830
Author:Amos Gilat
Publisher:John Wiley & Sons Inc
Probability and Statistics for Engineering and th...
Statistics
ISBN:9781305251809
Author:Jay L. Devore
Publisher:Cengage Learning
Statistics for The Behavioral Sciences (MindTap C...
Statistics
ISBN:9781305504912
Author:Frederick J Gravetter, Larry B. Wallnau
Publisher:Cengage Learning
Elementary Statistics: Picturing the World (7th E...
Statistics
ISBN:9780134683416
Author:Ron Larson, Betsy Farber
Publisher:PEARSON
The Basic Practice of Statistics
Statistics
ISBN:9781319042578
Author:David S. Moore, William I. Notz, Michael A. Fligner
Publisher:W. H. Freeman
Introduction to the Practice of Statistics
Statistics
ISBN:9781319013387
Author:David S. Moore, George P. McCabe, Bruce A. Craig
Publisher:W. H. Freeman