
MATLAB: An Introduction with Applications
6th Edition
ISBN: 9781119256830
Author: Amos Gilat
Publisher: John Wiley & Sons Inc
expand_more
expand_more
format_list_bulleted
Related questions
Question
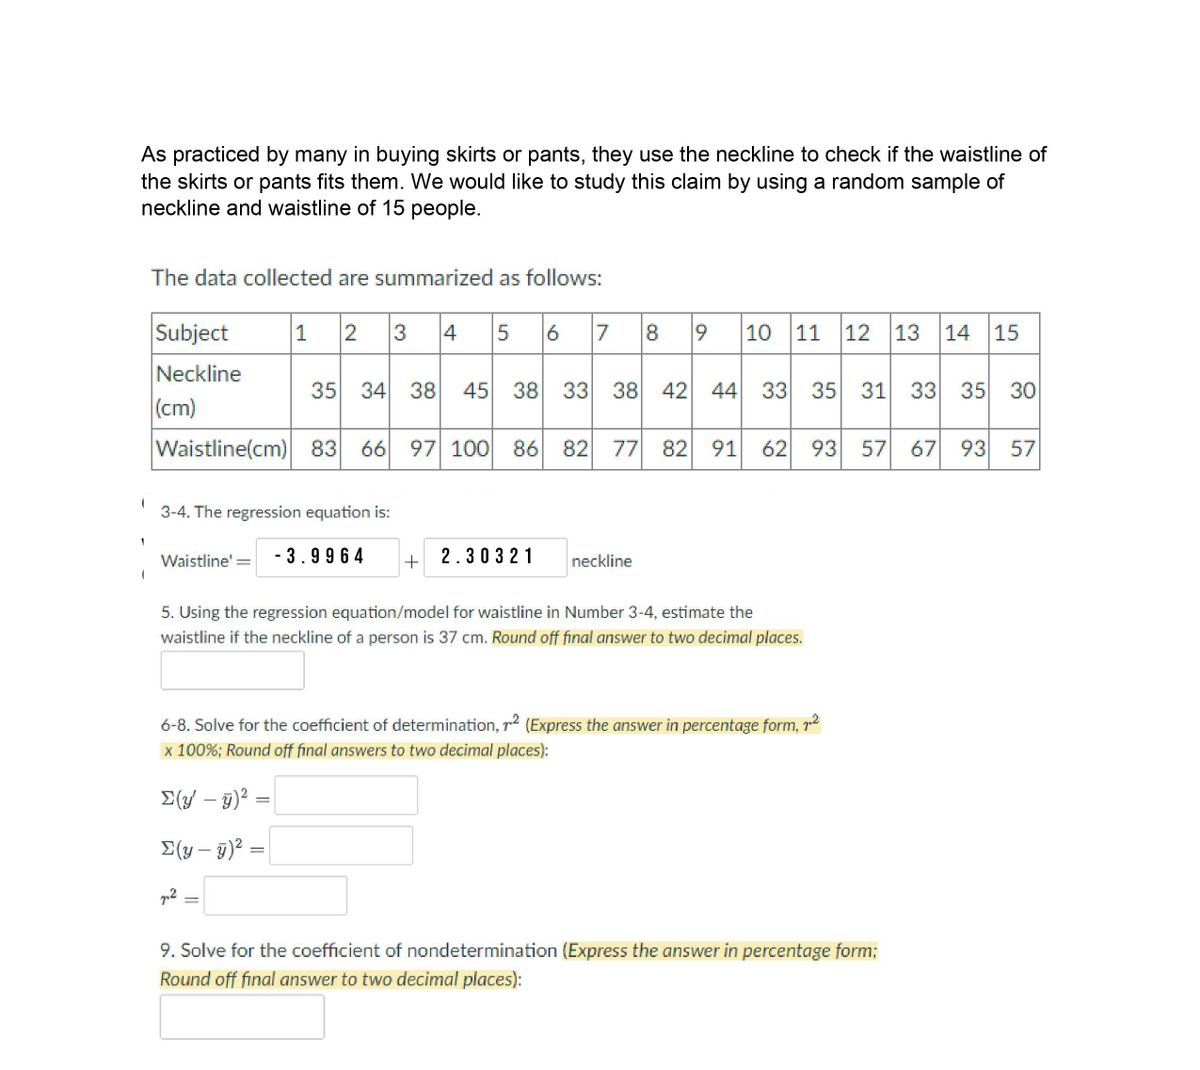

Transcribed Image Text:As practiced by many in buying skirts or pants, they use the neckline to check if the waistline of
the skirts or pants fits them. We would like to study this claim by using a random sample of
neckline and waistline of 15 people.
The data collected are summarized as follows:
Subject
1 2 3
4
5 6 7 8 9
10 11 12
14 15
13
Neckline
35 34 38
45
38 33 38
42 44
33 35 31 33
35 30
(cm)
Waistline(cm) 83
97 100
86 82 77
82 91
62 93
57 67 93
57
3-4. The regression equation is:
Waistline' =
- 3.9964
2.30321
neckline
5. Using the regression equation/model for waistline in Number 3-4, estimate the
waistline if the neckline of a person is 37 cm. Round off final answer to two decimal places.
6-8. Solve for the coefficient of determination, r2 (Express the answer in percentage form, r2
x 100%; Round off final answers to two decimal places):
E(y/ – 9)² =
E(y – 9)² =
9. Solve for the coefficient of nondetermination (Express the answer in percentage form;
Round off final answer to two decimal places):
Expert Solution
This question has been solved!
Explore an expertly crafted, step-by-step solution for a thorough understanding of key concepts.

Step by stepSolved in 4 steps with 1 images

Knowledge Booster

Similar questions
- 20. Given the information below, what kind of samples are being described? Sample 1: Test scores for 35 statistics students. Sample 2: Test scores for 42 biology students who do not study statistics. A. Dependent samples B. Unknown samples C. Independent samples D. One samplearrow_forwardThe heights (in centimeters) of some randomly selected Men's World Cup soccer players from both Europe and the U.S. are given below. Europe 169 170 171 175 175 175 178 180 181 182 184 185 185 187 189 United States 167 168 169 173 176 176 178 180 180 181 183 183 186 187 187 Is there a difference between the heights of European and American soccer players? What is the test statistic for this test? 0.7399 0.3352 0.3700 0.6648 0.2601arrow_forward3. What is the sample mean for the following sample of scores? Scores: 1, 2, 5, 4arrow_forward
- The income of residents of Chicago, IL has a bell shaped and symmetric histogram, with a mean of $65,000 and a S.D. of $13,000. 1) What percentage of residents have an income more than $78,000 or less than $52,000? 2) what percentage of residents have an income between $39,000 and $91,000? 3) What percentage of residents have an income less than $104,000? 4) What percentage have an income more than $65000? 5) Less than $26,000 Hint: you need to draw a curve for each part 1-4, and calculate the mean ± 1, 2, 3 S.D.arrow_forwardAnother type of painted ceramic vessel is called three-circle red-on-white ( Mimbres Mogollon Archaeology). At four different sites in the Wind Mountain archaeological region, the number of such sherds was counted in local dwelling excavations. Site I Site II Site III Site IV 15 13 38 15 22 2 20 21 4 31 15 13 15 7 44 34 17 23 12 11 12 Shall we reject or not reject the claim that there is no difference in the population mean three-circle red-on-white sherd counts for the four sites? Use a 5% level of significance. (a) What is the level of significance? (b) Find SSTOT, SSBET, and SSW and check that SSTOT = SSBET + SSW. (Use 3 decimal places.) SSTOT = SSBET = SSW = Find d.f.BET, d.f.W, MSBET, and MSW. (Use 3 decimal places for MSBET, and MSW.) dfBET = dfW = MSBET = MSW = Find the value of the sample F statistic. (Use 3 decimal places.)What are the degrees of freedom??(numerator)?(denominator)(c) Find the P-value of the sample…arrow_forward1. Sample data about the listing price of a house is collected from Surrey, Guilford area in 2022 and the data is given below. Using the data answer the following questions: N 1 2 3 4 5 Listing Price 1049900 11 1229000 1049900 12 1230000 1050000 13 1075000 14 1298999 1299000 1299000 1075000 15 16 1398000 1078800 1179000 17 18 1398000 1399000 1188000 1188000 19 1449900 1225000 20 1450000 a. What is the mean listing price of a home? b. Generate appropriate numerical summaries for the listing price of a home, the sample standard deviation, etc. 6 7 8 9 10 Listing Price N Listing Price 21 1450000 22 1450000 23 1469900 24 1475000 25 1475000 26 1480000 1499000 27 28 1499000 29 1499233 30 1499900 N C. Use these summaries to develop a 95% confidence interval to estimate the mean listing price of a house in your selected city. That is, you will be using the sampling data you collected to estimate the population parameter (listing price). Make sure to show both your calculations and a final…arrow_forward
- a) Based on the histogram above, what is the class width? b) What is the sample size? Frequency 5.0- 4.0- 3.0- 2.0- 1.0- .0 20 30 40 50 60 Age 70 80 90 100arrow_forwardMy electric bills for June, July, and August last summer were $75, $75, and $150, respectively. What was the mean amount for the three bills? Question 14 options: $75 $100 $125 $150arrow_forward1. The table below includes the height and weight measurements for a random sample of 18 female Olympic athletes. Second name Edmonds Oyepitan Steryiou Araujo Pinto Moniz Allegrini Jerzyk Height(cm) 172 165 180 169 168 166 162 170 166 162 178 164 172 170 164 167 177 171 Weight (kg) Country/Team 70 Team GB Team GB 57 59 60 62 105 57 58 56 56 68 47 56 49 65 57 80 56 Greece Brazil Brazil Cape Verde Italy Poland Poland Hungary Russian Federation Kazakhstan Team GB Japan Skrzypulec Mohamed Shanaeva Zhexembinova Willmott Hatakeyama Nchout Dawidowicz Matoshka Danson Cameroon Poland Belarus Team GB a) Determine the range and IQR for the height variable (do NOT use Excel for IQR). b) Draw a boxplot for the height variable. Write the values for the lower and upper boundaries on the plot. Are there any outliers in the sample? c) Based on the boxplot, describe the shape of the distribution for the height variable (symmetrical, positively skewed, or negatively skewed)... d) Calculate variance &…arrow_forward
- QUESTION 4 Find the median for the given sample data. The number of vehicles passing through a bank drive- up line during each 15- minute period was recorded. The results are shown below. Find the median number of vehicles going through the line in a fifteen- minute period. 20 22 20 23 23 20 25 22 30 26 26 24 19 26 20 15 10 22 22 22 O 23 22 26 O 21.85 QUESTION 5 Construct a boxplot for the given data. Include values of the 5 -number summary in all boxplots. The weights (in pounds) of 30 newborm babies are listed below. Construct a boxplot for the data set. 5.55.758 5.9 6.1 6.1 63 646.5 6.6 676767K070707.0717272 Save A thmit Click Saue All Answers to save all answers.arrow_forwardNonearrow_forwardQUESTION 8 Find the mode(s) for the given sample data. 20, 38, 46, 38, 49, 38, 49 49 38 39.7 46arrow_forward
arrow_back_ios
SEE MORE QUESTIONS
arrow_forward_ios
Recommended textbooks for you
- MATLAB: An Introduction with ApplicationsStatisticsISBN:9781119256830Author:Amos GilatPublisher:John Wiley & Sons Inc
 Probability and Statistics for Engineering and th...StatisticsISBN:9781305251809Author:Jay L. DevorePublisher:Cengage Learning
 Statistics for The Behavioral Sciences (MindTap C...StatisticsISBN:9781305504912Author:Frederick J Gravetter, Larry B. WallnauPublisher:Cengage Learning
  Elementary Statistics: Picturing the World (7th E...StatisticsISBN:9780134683416Author:Ron Larson, Betsy FarberPublisher:PEARSON
 The Basic Practice of StatisticsStatisticsISBN:9781319042578Author:David S. Moore, William I. Notz, Michael A. FlignerPublisher:W. H. Freeman
 Introduction to the Practice of StatisticsStatisticsISBN:9781319013387Author:David S. Moore, George P. McCabe, Bruce A. CraigPublisher:W. H. Freeman
MATLAB: An Introduction with Applications
Statistics
ISBN:9781119256830
Author:Amos Gilat
Publisher:John Wiley & Sons Inc
Probability and Statistics for Engineering and th...
Statistics
ISBN:9781305251809
Author:Jay L. Devore
Publisher:Cengage Learning
Statistics for The Behavioral Sciences (MindTap C...
Statistics
ISBN:9781305504912
Author:Frederick J Gravetter, Larry B. Wallnau
Publisher:Cengage Learning
Elementary Statistics: Picturing the World (7th E...
Statistics
ISBN:9780134683416
Author:Ron Larson, Betsy Farber
Publisher:PEARSON
The Basic Practice of Statistics
Statistics
ISBN:9781319042578
Author:David S. Moore, William I. Notz, Michael A. Fligner
Publisher:W. H. Freeman
Introduction to the Practice of Statistics
Statistics
ISBN:9781319013387
Author:David S. Moore, George P. McCabe, Bruce A. Craig
Publisher:W. H. Freeman