
Step by stepSolved in 5 steps with 1 images

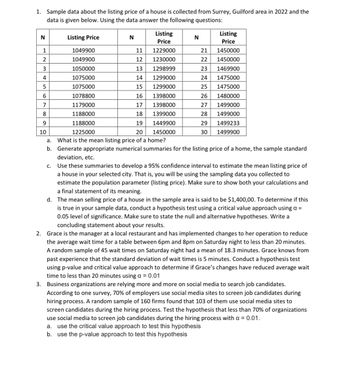
Grace is the manager at a local restaurant and has implemented changes to her operation to reduce
the average wait time for a table between 6pm and 8pm on Saturday night to less than 20 minutes.
A random sample of 45 wait times on Saturday night had a
past experience that the standard deviation of wait times is 5 minutes. Conduct a hypothesis test
using p-value and critical value approach to determine if Grace’s changes have reduced average wait
time to less than 20 minutes using α = 0.01
- Here is a set of sample data. 43 75 64 40 50 11 91 99 44 82 39 25 35 86 60 2 27 83 45 65 1 93 88 10 Base on the data above, identify the 5 number summaryarrow_forwardConstruct a frequency polygon from the following scores: 11, 7, 12, 8, 10, 9, 10, 10, 8, 9, 11, 10, 9, 7, 8, 6, 11, 9arrow_forward8. Find the mean, median, mode and range for the following set of values: 2 8 5 8 28 2arrow_forward
- A)Find the mean, median, mode, and range for the following data set 59,65,70,71,71,74,75,78,80,83,84,87,91,98,100 B)find the five number summary and draw a box plot. Briefly describe the shape and variation of the distribution. Explain your results.arrow_forward......arrow_forwardDetermine which of the four levels of measurement ( norminal, ordinal, interval, ratio) is most appropriate for the data below. Years in which U.S. presidents were inauguratedarrow_forward
- The following items represent the number of birds observed at a given feeder over the past several days. What is the median number of birds to visit that feeder? 23, 35, 92, 76, 36, 48, 34, 12 Round to 2 decimal places as neededarrow_forwardA group of fairy-tale characters were surveyed about their pet preferences. The results of the survey are summarized in the two-way frequency table. Ogre Princess Dragon Unicorn Totals 22 31 12 31 43 21 Totals Convert this table to a two-way relative frequency table. Round the values to the nearest whole percent. 53 74 You may use one of the following methods to create your table: A • Use word processing software such as Word, Pages, Writer, or other software that allows you to create a table with rows and columns. • Use paper and pencil, or any other method to draw a table. Be sure to scan and save the file and attach the file to your answer for this question.arrow_forwardA used car dealer says that the mean price of a three-year-old sports utility vehicle is $19,000. You suspect this claim is incorrect and find that a random sample of 22 similar vehicles has a mean price of $19,580 and a standard deviation of $1921. Is there enough evidence to reject the claim at α=0.01? Complete parts (a) through (e) below. Assume the population is normally distributed. (a) Write the claim mathematically and identify H0 and Ha. Which of the following correctly states H0 and Ha? A. H0: μ=$19,000 Ha: μ≠$19,000 This is the correct answer. B. H0: μ>$19,000 Ha: μ≤$19,000 Your answer is not correct. C. H0: μ≥$19,000 Ha: μ<$19,000 D. H0: μ=$19,000 Ha: μ>$19,000 E. H0: μ≠$19,000 Ha: μ=$19,000 F. H0: μ=$19,000 Ha: μ<$19,000 (b) Find the critical value(s) and identify the rejection region(s). What is(are) the critical value(s), t0?…arrow_forward
 MATLAB: An Introduction with ApplicationsStatisticsISBN:9781119256830Author:Amos GilatPublisher:John Wiley & Sons Inc
 Probability and Statistics for Engineering and th...StatisticsISBN:9781305251809Author:Jay L. DevorePublisher:Cengage Learning
 Statistics for The Behavioral Sciences (MindTap C...StatisticsISBN:9781305504912Author:Frederick J Gravetter, Larry B. WallnauPublisher:Cengage Learning
 Elementary Statistics: Picturing the World (7th E...StatisticsISBN:9780134683416Author:Ron Larson, Betsy FarberPublisher:PEARSON
 The Basic Practice of StatisticsStatisticsISBN:9781319042578Author:David S. Moore, William I. Notz, Michael A. FlignerPublisher:W. H. Freeman
 Introduction to the Practice of StatisticsStatisticsISBN:9781319013387Author:David S. Moore, George P. McCabe, Bruce A. CraigPublisher:W. H. Freeman


