Holt Mcdougal Larson Pre-algebra: Student Edition 2012
1st Edition
ISBN: 9780547587776
Author: HOLT MCDOUGAL
Publisher: HOLT MCDOUGAL
expand_more
expand_more
format_list_bulleted
Question
thumb_up100%

Transcribed Image Text:D...
CUN Official Cancuh Alr.
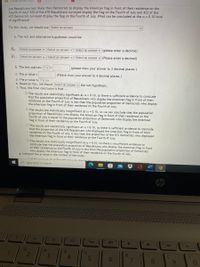
Are Republicans less likely than Democrats to display the American flag in front of their residence on the
Fourth of July? 420 of the 678 Republicans surveyed display the flag on the Fourth of July and 433 of the
672 Democrats surveyed display the flag on the Fourth of July. What can be concluded at the a = 0.10 level
of significance?
%3D
For this study, we should use Select an answer
a. The null and alternative hypotheses would be:
Ho: Select an answer v Select an answer v Select an answer v (please enter a decimal)
H: Select an answer v Select an answer v Select an answer v (Please enter a decimal)
b. The test statistic ? v =
(please show your answer to 3 decimal places.)
c. The p-value =
(Please show your answer to 4 decimal places.)
d. The p-value is ? v a
e. Based on this, we should Select an answer v the null hypothesis.
f. Thus, the final conclusion is that ...
O The results are statistically significant at a = 0.10, so there is sufficient evidence to conclude
that the population proportion of Republicans who display the American flag in front of their
residence on the Fourth of July is less than the population proportion of Democrats who display
the American flag in front of their residence on the Fourth of July.
O The results are statistically insignificant at a = 0.10, so we can conclude that the population
proportion of Republicans who display the American flag in front of their residence on the
Fourth of July is equal to the population proportion of Democrats who display the American
flag in front of their residence on the Fourth of July.
O The results are statistically significant at a = 0.10, so there is sufficient evidence to conclude
that the proportion of the 678 Republicans who displayed the American flag in front of their
residence on the Fourth of July is less than the proportion of the 672 Democrats who displayed
the American flag in front of their residence on the Fourth of July.
O The results are statistically insignificant at a = 0.10, so there is insufficient evidence to
conclude that the population proportion of Republicans who display the American flag in front
of their residence on the Fourth of July is less than the population proportion of Democrats
who display the American flag in front of their residence on the Fourth of July.
g. Interpret the p-value in the context of the study.
DKthe noreontaall Demublienne he dienlythe
flag in fcen
P Type here to search
Is
16
IOI
10
19
144
4+
ho
%23
24
&
3
4.
08.
9.
5

Transcribed Image Text:who display the American flag in front of their residence on the Fourth of July.
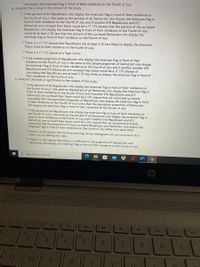
g. Interpret the p-value in the context of the study.
O If the percent of all Republicans who display the American flag in front of their residence on
the Fourth of July is the same as the percent of all Democrats who display the American flag in
front of their residence on the Fourth of July and if another 678 Republicans and 672
Democrats are surveyed then there would be a 17.17% chance that the percent of the surveyed
Republicans who display the American flag in front of their residence on the Fourth of July
would be at least 2.5% less than the percent of the surveyed Democrats who display the
American flag in front of their residence on the Fourth of July.
O There is a 17.17% chance that Republicans are at least 2.5% less likely to display the American
flag in front of their residence on the Fourth of July.
O There is a 17.17% chance of a Type I error.
O If the sample proportion of Republicans who display the American flag in front of their
residence on the Fourth of July is the same as the sample proportion of Democrats who display
the American flag in front of their residence on the Fourth of July and if another another 678
Republicans and 672 Democrats are surveyed then there would be a 17.17% chance of
concluding that Republicans are at least 2.5% less likely to display the American flag in front of
their residence on the Fourth of July
h. Interpret the level of significance in the context of the study.
O If the percent of all Republicans who display the American flag in front of their residence on
the Fourth of July is the same as the percent of all Democrats who display the American flag in
front of their residence on the Fourth of July and if another 678 Republicans and 672
Democrats are surveyed then there would be a 10% chance that we would end up falsely
concuding that the population proportion of Republicans who display the American flag in front
of their residence on the Fourth of July is less than the population proportion of Democrats
who display the American flag in front of their residence on the Fourth of July
O If the percent of all Republicans who display the American flag in front of their residence on
the Fourth of July is the same as the percent of all Democrats who display the American flag in
front of their residence on the Fourth of July and if another 678 Republicans and 672
Democrats are surveyed then there would be a 10% chance that we would end up falsely
concuding that the proportion of these surveyed Republicans and Democrats who display the
American flag in front of their residence on the Fourth of July differ from each other.
O There is a 10% chance that the American flag will be redesigned with your picture on it to
honor you for passing this class.
O There is a 10% chance that there is a difference in the proportion of Republicans and
Democrats who display the American flag in front of their residence on the Fourth of July.
P Type here to search
sc
to
144
ho
11
L
%23
24
4.
7.
2
3
5
6
08.
E
60
Expert Solution
This question has been solved!
Explore an expertly crafted, step-by-step solution for a thorough understanding of key concepts.
Step by stepSolved in 2 steps

Knowledge Booster
Recommended textbooks for you
 Holt Mcdougal Larson Pre-algebra: Student Edition...AlgebraISBN:9780547587776Author:HOLT MCDOUGALPublisher:HOLT MCDOUGAL
 Glencoe Algebra 1, Student Edition, 9780079039897...AlgebraISBN:9780079039897Author:CarterPublisher:McGraw Hill
 College Algebra (MindTap Course List)AlgebraISBN:9781305652231Author:R. David Gustafson, Jeff HughesPublisher:Cengage Learning
 Big Ideas Math A Bridge To Success Algebra 1: Stu...AlgebraISBN:9781680331141Author:HOUGHTON MIFFLIN HARCOURTPublisher:Houghton Mifflin Harcourt

Holt Mcdougal Larson Pre-algebra: Student Edition...
Algebra
ISBN:9780547587776
Author:HOLT MCDOUGAL
Publisher:HOLT MCDOUGAL

Glencoe Algebra 1, Student Edition, 9780079039897...
Algebra
ISBN:9780079039897
Author:Carter
Publisher:McGraw Hill

College Algebra (MindTap Course List)
Algebra
ISBN:9781305652231
Author:R. David Gustafson, Jeff Hughes
Publisher:Cengage Learning

Big Ideas Math A Bridge To Success Algebra 1: Stu...
Algebra
ISBN:9781680331141
Author:HOUGHTON MIFFLIN HARCOURT
Publisher:Houghton Mifflin Harcourt