MATLAB: An Introduction with Applications
6th Edition
ISBN: 9781119256830
Author: Amos Gilat
Publisher: John Wiley & Sons Inc
expand_more
expand_more
format_list_bulleted
Question

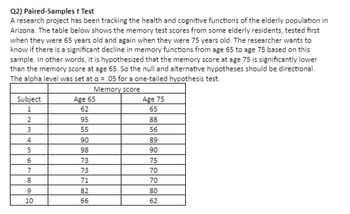
Transcribed Image Text:Q2) Paired-Samples t Test
A research project has been tracking the health and cognitive functions of the elderly population in
Arizona. The table below shows the memory test scores from some elderly residents, tested first
when they were 65 years old and again when they were 75 years old. The researcher wants to
know if there is a significant decline in memory functions from age 65 to age 75 based on this
sample. In other words, it is hypothesized that the memory score at age 75 is significantly lower
than the memory score at age 65. So the null and alternative hypotheses should be directional.
The alpha level was set at a = .05 for a one-tailed hypothesis test.
Memory score
Subject
1
2
3
4
5
6
7
8
9
10
Age 65
62
95
55
90
98
73
73
71
82
66
Age 75
65
88
56
89
90
75
70
70
80
62

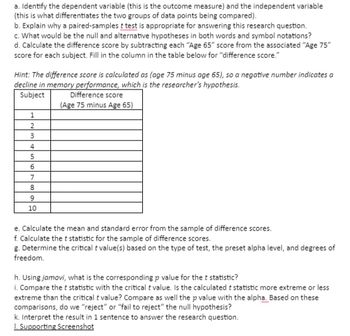
Transcribed Image Text:a. Identify the dependent variable (this is the outcome measure) and the independent variable
(this is what differentiates the two groups of data points being compared).
b. Explain why a paired-samples t test is appropriate for answering this research question.
c. What would be the null and alternative hypotheses in both words and symbol notations?
d. Calculate the difference score by subtracting each "Age 65" score from the associated "Age 75"
score for each subject. Fill in the column in the table below for "difference score."
Hint: The difference score is calculated as (age 75 minus age 65), so a negative number indicates a
decline in memory performance, which is the researcher's hypothesis.
Subject
1
2
3
4
5
6
7
8
9
10
Difference score
(Age 75 minus Age 65)
e. Calculate the mean and standard error from the sample of difference scores.
f. Calculate the t statistic for the sample of difference scores.
g. Determine the critical t value(s) based on the type of test, the preset alpha level, and degrees of
freedom.
h. Using jamovi, what is the corresponding p value for the t statistic?
i. Compare the t statistic with the critical t value. Is the calculated t statistic more extreme or less
extreme than the critical t value? Compare as well the p value with the alpha. Based on these
comparisons, do we "reject" or "fail to reject" the null hypothesis?
k. Interpret the result in 1 sentence to answer the research question.
1. Supporting Screenshot
Expert Solution
This question has been solved!
Explore an expertly crafted, step-by-step solution for a thorough understanding of key concepts.
Step by stepSolved in 4 steps

Knowledge Booster
Similar questions
- If Ashley wants to test for GPA differences among first-, second-, third-, and fourth-year college students, which of these difference tests should she use? a. chi square test of independence b. between-subjects, two-way ANOVA. c. chi square goodness of fit test d. between-subjects, one-way ANOVA.arrow_forwardQ18. Why do we conduct post hoc analysis in ANOVA? a. To make a comparison on individual adjusted R-squares B. To make a comparison of the individual group meansC. To make a comparison of the individual group scatter plots D. None of the abovearrow_forwardThe table below summarizes data from a survey of a sample of women. Using a 0.05 significance level, and assuming that the sample sizes of 900 men and 400 women are predetermined, test the claim that the proportions of agree/disagree responses are the same for subjects interviewed by men and the subjects interviewed by women. Does it appear that the gender of the interviewer affected the responses of women? Q Women who agree Women who disagree Gender of Interviewer Man 555 345 Woman 318 82 Identify the null and alternative hypotheses. Choose the correct answer below. A. Ho: The proportions of agree/disagree responses are the same for the subjects interviewed by men and the subjects interviewed by women. H₁: The proportions are different. B. Ho: The proportions of agree/disagree responses are different for the subjects interviewed by men and the subjects interviewed by women. H₁: The proportions are the same. OC. Ho: The response of the subject and the gender of the subject are…arrow_forward
- In a population of 150 pea plants, there are 89 tall-purple plants, 25 short-purple plants, 28 tall-white plants, and 8 short-white plants. In order to test if the two traits are experiencing independent assortment researchers would perform a chi squared test. What is your calculated Chi Squared statistic? What is the corresponding P value?arrow_forwardIs the proportion of wildfires caused by humans in the south different from the proportion of wildfires caused by humans in the west? 372 of the 563 randomly selected wildfires looked at in the south were caused by humans while 372 of the 521 randomly selected wildfires looked at the west were caused by humans. What can be concluded at the a 0.05 level of significance? a. For this study, we should use Select an answer b. The null and alternative hypotheses would be: Ho: Select an answerv Select an answerv Select an answerv (please enter a decimal) H: Select an answerv Select an answerv Select an answerv (Please enter a decimal) C. The test statistic ?v = (please show your answer to 3 decimal places.) d. The p-value = (Please show your answer to 4 decimal places.) e. The p-value is ? a f. Based on this, we should Select an answerv the null hypothesis. g. Thus, the final conclusion is that ... O The results are statistically insignificant conclude that the population proportion from the…arrow_forwardIs the proportion of wildfires caused by humans in the south higher than the proportion of wildfires caused by humans in the west? 380 of the 581 randomly selected wildfires looked at in the south were caused by humans while 318 of the 503 randomly selected wildfires looked at the west were caused by humans. What can be concluded at the a = 0.10 level of significance? a. For this study, we should use Select an answer b. The null and alternative hypotheses would be: Ho: Select an answer v Select an answer Select an answer v (please enter a decimal) Hj: Select an answer Select an answer vSelect an answer v (Please enter a decimal) c. The test statistic ? v (please show your answer to 3 decimal places.) d. The p-value = (Please show your answer to 4 decimal places.) e. The p-value is ? a f. Based on this, we should Select an answer g. Thus, the final conclusion is that ... |the null hypothesis. O The results are statistically significant at a = 0.10, so there is sufficient evidence to…arrow_forward
- What is one indication that there are paired samples in a data set? Choose the correct answer below. O A. Knowing the value that a subject has in one group gives one no information about the value in the second group. OB. Each observation in one group is coupled with one particular observation in the other group. OC. The researcher is comparing two populations. O D. The researcher is working with two distinct groups in the data set.arrow_forwardA researcher wanted to test whether there is a relationship between preferred sweet (Oreo cookies, Mars bars, or Twinkies) and age group (children, adolescents, or young adults). To test that, subjects from the three age groups were asked which of the three sweets they preferred. Which statistical test should be used to analyze the data? 1. chi square test of independece 2. chi square test for goodness of fit 3. one sample t test 4. one way anova testarrow_forwardIn the General Social Survey, respondents were asked "If your party nominated a woman for President, would you vote for her if she were qualified for the job?" A two-way table summarizing the results for 953 respondents, by gender, is shown below: Gender Female Male Total Vote for female candidate? Yes No 488 66 335 64 823 130 The chi-square test statistic = 3.35. At a significance level of 0.05, what is your conclusion? O The null hypothesis is not rejected: there is no association between gender and support for a female president Total 554 399 953 O The null hypothesis is rejected: there is an association between gender and support for a female president. O The null hypothesis is not rejected: there is an association between gender and support for a female president. ty O The null hypothesis is rejected: there is no association between gender and support for a female president. Q Search or enter address +arrow_forward
- If Ashley wants to test for GPA differences among first-, second-, third-, and fourth-year college students, which of these difference tests should she use? A. chi-square test of independence B. between-subjects, two-way ANOVA C. between-subjects, one-way ANOVA D. repeated-measures ANOVAarrow_forwardA professor wanted to determine if the GPAS of students at Saddleback College are less consistent than the GPAS of students at Irvine Valley College. To test this, he obtains random samples of students from both colleges and records their GPAS, which are given below. Test the professor's claim at the a=0.05 level of significance. Saddleback College Irvine Valley College 3.7 3.2 3.0 2.5 2.7 3.6 4.0 3.4 3.8 3.2 3.0 2.5 3.6 2.8 2.6 2.5 2.1 2.7 3.9 3.4 2.0 2.2 2.7 3.1 2.0 2.0 2.1 3.8 3.1 2.9 3.2 2.8 Calculator Function [ Select] [ Select] 2-PropZTest ANOVA X^2-Test T-Test 2-SampTTest 2-SampFTest [ Select] v sufficient evidence that the standard deviation of grades for Saddleback College students is [ Select] than the standard deviation for Irvine Valley College students.arrow_forwardWhat statistical analysis could be used to determine whether the unsuccessful dieters attained a significantly different percentage from their weight-loss goal, on average, than did the successful dieters? single-sample t test In which of the following four categories does this situation fall? a. only scale variables b. nominal independent variables, scale dependent variable c. only nominal variables d. any ordinal variables (that cannot be treated as nominal)arrow_forward
arrow_back_ios
SEE MORE QUESTIONS
arrow_forward_ios
Recommended textbooks for you
 MATLAB: An Introduction with ApplicationsStatisticsISBN:9781119256830Author:Amos GilatPublisher:John Wiley & Sons Inc
 Probability and Statistics for Engineering and th...StatisticsISBN:9781305251809Author:Jay L. DevorePublisher:Cengage Learning
 Statistics for The Behavioral Sciences (MindTap C...StatisticsISBN:9781305504912Author:Frederick J Gravetter, Larry B. WallnauPublisher:Cengage Learning
 Elementary Statistics: Picturing the World (7th E...StatisticsISBN:9780134683416Author:Ron Larson, Betsy FarberPublisher:PEARSON
 The Basic Practice of StatisticsStatisticsISBN:9781319042578Author:David S. Moore, William I. Notz, Michael A. FlignerPublisher:W. H. Freeman
 Introduction to the Practice of StatisticsStatisticsISBN:9781319013387Author:David S. Moore, George P. McCabe, Bruce A. CraigPublisher:W. H. Freeman

MATLAB: An Introduction with Applications
Statistics
ISBN:9781119256830
Author:Amos Gilat
Publisher:John Wiley & Sons Inc

Probability and Statistics for Engineering and th...
Statistics
ISBN:9781305251809
Author:Jay L. Devore
Publisher:Cengage Learning

Statistics for The Behavioral Sciences (MindTap C...
Statistics
ISBN:9781305504912
Author:Frederick J Gravetter, Larry B. Wallnau
Publisher:Cengage Learning

Elementary Statistics: Picturing the World (7th E...
Statistics
ISBN:9780134683416
Author:Ron Larson, Betsy Farber
Publisher:PEARSON

The Basic Practice of Statistics
Statistics
ISBN:9781319042578
Author:David S. Moore, William I. Notz, Michael A. Fligner
Publisher:W. H. Freeman

Introduction to the Practice of Statistics
Statistics
ISBN:9781319013387
Author:David S. Moore, George P. McCabe, Bruce A. Craig
Publisher:W. H. Freeman