MATLAB: An Introduction with Applications
6th Edition
ISBN: 9781119256830
Author: Amos Gilat
Publisher: John Wiley & Sons Inc
expand_more
expand_more
format_list_bulleted
Concept explainers
Topic Video
Question

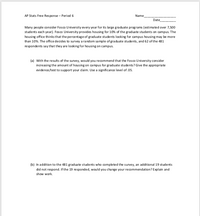
Transcribed Image Text:AP Stats Free Res ponse - Period 6
Name
Date
Many people consider Fosco University every year for its large graduate programs (estimated over 7,500
students each year). Fos co University provides housing for 10% of the gradua te students on campus. The
housing office thinks that the percentage of graduate students looking for campus housing may be more
than 10%. The office decides to survey a random sa mple of graduate students, and 62 of the 481
respondents say that they are looking for housing on campus.
(a) With the results of the survey, would you recommend that the Fosco U niversity consider
increasing the amount of housing on campus for graduate students? Give the appropriate
evidence/test to support your dlaim. Use a significance level of.05.
(b) In addition to the 481 graduate students who completed the survey, an additional 19 students
did not respond. If the 19 responded, would you change your recommendation? Explain and
show work.

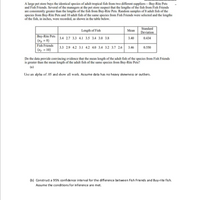
Transcribed Image Text:A large pet store buys the identical species of adult tropical fish from two different suppliers-Buy-Rite Pets
and Fish Friends. Several of the managers at the pet store suspect that the lengths of the fish from Fish Friends
are consistently greater than the lengths of the fish from Buy-Rite Pets. Random samples of 8 adult fish of the
species from Buy-Rite Pets and 10 adult fish of the same species from Fish Friends were selected and the lengths
of the fish, in inches, were recorded, as shown in the table below.
Standard
Length of Fish
Mean
Deviation
Buy-Rite Pets 3.4 2.7 3.3 4.1 3.5 3.4 3.0 3.8
| (n, = 8)
Fish Friends 3.3 29 42 3.1 4.2 4.0 3.4 3.2 3.7 2.6 3.46
| (n, = 10)
3.40
0.434
0.550
Do the data provide convincing evidence that the mean length of the adult fish of the species from Fish Friends
is greater than the mean length of the adult fish of the same species from Buy-Rite Pets?
(a)
Use an alpha of .05 and show all work. Assume data has no heavy skewness or outliers.
(b) Construct a 95% confidence interval for the difference between Fish Friends and Buy-rite fish.
Assume the conditions for inference are met.
Expert Solution
This question has been solved!
Explore an expertly crafted, step-by-step solution for a thorough understanding of key concepts.
This is a popular solution
Trending nowThis is a popular solution!
Step by stepSolved in 4 steps

Knowledge Booster
Learn more about
Need a deep-dive on the concept behind this application? Look no further. Learn more about this topic, statistics and related others by exploring similar questions and additional content below.Similar questions
- Thirty-five percent of all Americans drink bottled water more than once a week (Natural resources Defense Council, December 4, 2015). Suppose you have been hired by the Natural Resources Defence Council to investigate bottled water consumption in St. Paul. You plan to select a sample of St. Paulites to estimate the proportion who drink bottled water more than once a week. Assume the popluation proportion of St. Paulites who drink bottled water more than once a week is 0.35 , the same as the overall proportion of Americans who drink bottled water more than once a week. Suppose you select a sample of 540 St. Paulites. Show the sampling distribution of “p with a line over it” (to 4 decimals). E(p with a line over it) = 0` p with a line over it = Based upon a sample of 540 St. Paulites, what is the probability that the sample proportion will be within 0.08 of the population proportion (to 4 decimals). Probability = Suppose you select a sample of 190 St. Paulites. Show the sampling…arrow_forwardYour statistics instructor often ponders the relationship between commute time and job satisfaction while driving back and forth to campus. Your instructor hypothesizes that people with a shorter commute time will have higher degrees of job satisfaction. Randomly sampling 600 Valley commuters, the instructor finds the following data listed in frequencies: Table 2: Commuters by Length of Commute and Job Satisfaction Job Satisfaction Number Who Commute 20 Minutes or Less Number Who Commute 21 to 40 Minutes Number Who Commute 41 Minutes or More Total Number for Each Level of Job Satisfaction Dissatisfied 10 60 140 210 Neutral 45 59 51 155 Satisfied 145 60 30 235 Total Number for Each Commute Time Range 200 179 221 1. Change frequencies to column percentages.arrow_forwardi’m sooo lost on how to do this question.arrow_forward
- About 4% of the population has a particular genetic mutation. 300 people are randomly selected.Find the mean for the number of people with the genetic mutation in such groups of 300. (Remember that means should be rounded to one more decimal place than the raw data.)arrow_forwardPage 160 #17 We predict that children exhibit more aggressive act after watching a violent television show. The scores for ten children were recorded before they watched a violent show and then after they watched a violent show. Aggression was measured in terms of number of aggressive acts (e.g. hitting, yelling, kicking etc). Sample 1 (after TV show): 5,6,4,4,7,3,2,1,4,1 Sample 2 (before TV show): 4,6,3,2,4,1,0,0,5,2 Is this a one-tailed or two-tailed test?arrow_forwardA district health officer wishes to determine if the six villages in his district are independent of residents contracting malaria, schistosomiasis, cholera or tuberculosis. Identity an appropriate statistical test and the tail of the test for the problem. Assume all samples used for study come from a normal population.arrow_forward
- An investigator wants to assess whether smoking is a risk factor for pancreatic cancer. Electronic medical records at a local hospital will be used to identify fifty patients with pancreatic cancer. One hundred patients who are similar but free of pancreatic cancer will also be selected. Each participant’s medical record will be analyzed for smoking history. Identify the type of study proposed. Briefly explain why you think the study is of this type. Indicate the study type's specific strengths and weaknesses. What is the most likely source of bias in the study .arrow_forwardImagine a study comparing two groups: undergrad vs. graduate students in terms of stress level. You find that 100% of the graduate students in your study are men and 100% of your undergraduate students are women. What effect does knowing the gender distribution have on your research conclusions?arrow_forwardAccording to the NIMH website the average number of adult Americans diagnosed with a “serious mental illness” across all 50 states in 2019 was μ = 5.2 out of 100 residents (or 5.2%). Please test to see if the sample of states listed below (n=8) has a significantly higher level of mental illness than the population mean of 5.2. Sample data: Arkansas= 5.45%, Montana=5.34%, Vermont=5.32%, Oregon=5.19%, Utah=5.2%, Ohio=5.13, Kentucky=5.25% West Virginia=5.18%. Hint - drop the % signs and use 5.45, 5.32, etc as the X scores. If you want you can use JASP for help with the calculations. Use 3 decimal places for the M, s, SEM. The alpha level for the study was set to α=.05. a. State the hypotheses of the study. b. Find the critical t value for this studyc. Compute the one-sample t test. d. Compute the Cohen's d for the data (even if not significant) e. State the results - is the sample significantly higher? Do you reject the null hypothesis? Report the t test results in APA format…arrow_forward
arrow_back_ios
arrow_forward_ios
Recommended textbooks for you
 MATLAB: An Introduction with ApplicationsStatisticsISBN:9781119256830Author:Amos GilatPublisher:John Wiley & Sons Inc
 Probability and Statistics for Engineering and th...StatisticsISBN:9781305251809Author:Jay L. DevorePublisher:Cengage Learning
 Statistics for The Behavioral Sciences (MindTap C...StatisticsISBN:9781305504912Author:Frederick J Gravetter, Larry B. WallnauPublisher:Cengage Learning
 Elementary Statistics: Picturing the World (7th E...StatisticsISBN:9780134683416Author:Ron Larson, Betsy FarberPublisher:PEARSON
 The Basic Practice of StatisticsStatisticsISBN:9781319042578Author:David S. Moore, William I. Notz, Michael A. FlignerPublisher:W. H. Freeman
 Introduction to the Practice of StatisticsStatisticsISBN:9781319013387Author:David S. Moore, George P. McCabe, Bruce A. CraigPublisher:W. H. Freeman

MATLAB: An Introduction with Applications
Statistics
ISBN:9781119256830
Author:Amos Gilat
Publisher:John Wiley & Sons Inc

Probability and Statistics for Engineering and th...
Statistics
ISBN:9781305251809
Author:Jay L. Devore
Publisher:Cengage Learning

Statistics for The Behavioral Sciences (MindTap C...
Statistics
ISBN:9781305504912
Author:Frederick J Gravetter, Larry B. Wallnau
Publisher:Cengage Learning

Elementary Statistics: Picturing the World (7th E...
Statistics
ISBN:9780134683416
Author:Ron Larson, Betsy Farber
Publisher:PEARSON

The Basic Practice of Statistics
Statistics
ISBN:9781319042578
Author:David S. Moore, William I. Notz, Michael A. Fligner
Publisher:W. H. Freeman

Introduction to the Practice of Statistics
Statistics
ISBN:9781319013387
Author:David S. Moore, George P. McCabe, Bruce A. Craig
Publisher:W. H. Freeman