
MATLAB: An Introduction with Applications
6th Edition
ISBN: 9781119256830
Author: Amos Gilat
Publisher: John Wiley & Sons Inc
expand_more
expand_more
format_list_bulleted
Related questions
Question
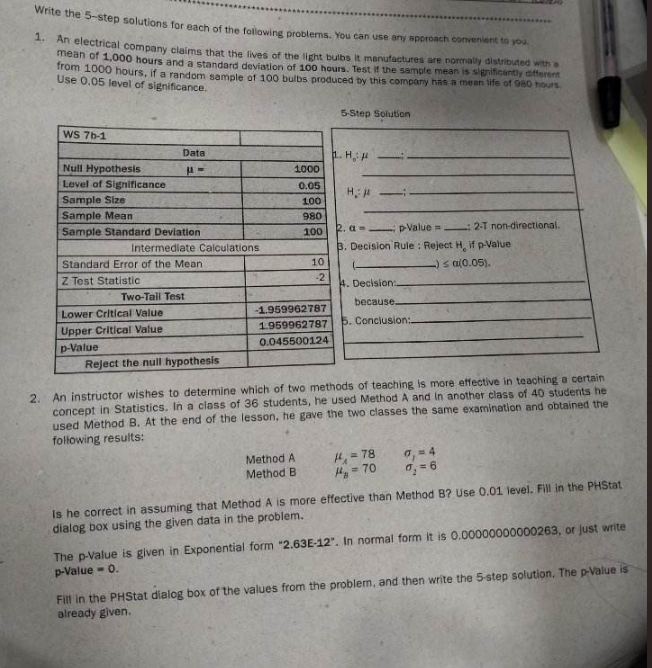

Transcribed Image Text:Write the 5-step solutions for each of the following problems. You can use any approach convenient to you.
1. An electrical company claims that the lives of the light bulbs it manufactures are normally distributed with a
mean of 1,000 hours and a standard deviation of 100 hours. Test if the sample mean is significantly different
from 1000 hours, if a random sample of 100 bulbs produced by this company has a mean life of 980 hours.
Use 0.05 level of significance.
WS 7b-1
Null Hypothesis
Level of Significance
Data
P=
Sample Size
Sample Mean
Sample Standard Deviation
Intermediate Calculations
Standard Error of the Mean
Z Test Statistic
Two-Tail Test
Lower Critical Value
Upper Critical Value
p-Value
Reject the null hypothesis
1000
0.05
100
980
100
10
-2
-1.959962787
1.959962787
0.045500124
Method A
Method B
5-Step Solution
1. H.
HA
2. a p-Value: 2-T non-directional.
3. Decision Rule: Reject H, if p-Value
-) ≤ a(0.05).
4. Decision:
because
5. Conclusion:
2. An instructor wishes to determine which of two methods of teaching is more effective in teaching a certain
concept in Statistics. In a class of 36 students, he used Method A and in another class of 40 students he
used Method B. At the end of the lesson, he gave the two classes the same examination and obtained the
following results:
H₁ =78
H₂ = 70
0₁ = 4
7₂ = 6
Is he correct in assuming that Method A is more effective than Method B? Use 0.01 level. Fill in the PHStat.
dialog box using the given data in the problem.
The p-value is given in Exponential form "2.63E-12". In normal form it is 0.00000000000263, or just write
p-Value - 0.
Fill in the PHStat dialog box of the values from the problem, and then write the 5-step solution. The p-Value is
already given.
Expert Solution
This question has been solved!
Explore an expertly crafted, step-by-step solution for a thorough understanding of key concepts.

Step by stepSolved in 6 steps

Knowledge Booster

Similar questions
- st • Question 14 You wish to test the following claim (Ha) at a significance level of a = 0.002. H.:p = 51.2 H.:p > 51.2 You believe the population is normally distributed, but you do not know the standard deviation. You obtain the following sample of data: data 69 58.6 62.8 sUcfocthis sampls/Repout.answeraccurato three ecarrow_forwardIn a study on running and happiness, runners indicated the number of miles they ran in a day and their subsequent score on a Happiness Survey (higher score = greater happiness). Runner # of miles (x) Happiness Score (y) 1 16 12 2 4 3 12 14 4 2 8 For these data: The mean of miles run is: 8.50 The mean of the Happiness scores is: 10.00 The standard deviation of the Miles scores is: 5.72 The standard deviation of the Happiness scores is: 3.16 In your submission, please include a copy of the SPSS or Excel output and answer the following: A. What is the r and r? value? B. Based on Pearson's r and r2 value, describe the relationship (direction/strength) that exists between # of miles run and Happiness scores. C. Create a scatterplot for the data using Excel or SPSS (include output in your submission). D. Insert the prediction line from Excel/SPSS on your scatterplot.arrow_forwardAssume the samples are random and independent, the populations are nomally distributed, and the population variances are equal. The table available below shows the prices (in dollars) for a sample of automobile batteries. The prices are classified according to battery type. At a = 0.10, is there enough evidence conclude that at least one mean battery price is different from the others? Complete parts (a) through (e) below. E Click the icon to view the battery cost data. (a) Let u1. P2. H3 represent the mean prices for the group size 35, 65, and 24/24F respectively. Identify the claim and state Ho and H. H Cost of batteries by type The claim is the V hypothesis. Group size 35 Group size 65 Group size 24/24F 101 111 121 124 D 146 173 182 278 124 140 141 89 (b) Find the critical value, Fo, and identify the rejection region. 90 79 84 The rejection region is F Fo, where Fo = (Round to two decimal places as needed.) (c) Find the test statistic F. Print Done F= (Round to two decimal places as…arrow_forward
- A new material will replace the old material only if there is significant evidence that the mean strength of the new material is more than 2 units higher than the mean strength of the old material. Sample from new material: mean is 98.064 , SD is 5.6 and sample size is 13 Sample from old material: mean is 95.282 , SD is 5.8 and sample size is 78 We do not know population standard deviations. Consider the test ?0:????−????=2H0:μnew−μold=2 vs. ?0:????−????>2H0:μnew−μold>2 What is the p-value? (Hint: best to use software, or else the Desmos Calculator for the 2 sample T and Z test) Give as a decimal between 0 and 1 accurate to at least 4 decimal places.arrow_forwardents • Question 6 ons The U.S. Census Bureau reported that the mean area of U.S. homes built in 2012 was 2505 square feet. A simple random sample of 26 homes built in 2013 had a mean area of 2711 square feet with a standard deviation of 212 feet. Can you conclude that the mean area of homes built in 2013 is greater than the mean area of homes built in 2012? It has been confirmed that home sizes followa normal distribution. Use a 10% significance level. Round to the fourth Hn: Select an answerv Select an answerv Course ons HA: Select an answerv Select an answerv Test Statistic: P-value: Did something significant happen? Select an answer Select the Decision Rule: Select an answer There Select an answerv enough evidence to conclude Select an answer Question Help: O Message instructor Submit Question 用 hp Ce #3 9% & 3 4. 6. 7 8. W d. 0. O 2A %23 %24arrow_forwardquestion is picturedarrow_forward
- Consider the following sample data. Sample A: 11, 22, 33 Sample B: 81, 92, 103 Sample C: 1,100; 1,111; 1,122 (a) Find the mean and standard deviation for each sample. Sample A: Sample B: Sample C: Mean Sample Standard Deviation (b) What does this exercise show about the standard deviation? multiple choice The idea is to illustrate that the standard deviation is not a function of the value of the mean. The idea is to illustrate that the standard deviation is a function of the value of the mean.arrow_forwardi already have answer in question A-C. please help me answer the rest. topic unknown standard variation thank youarrow_forward
arrow_back_ios
arrow_forward_ios
Recommended textbooks for you
- MATLAB: An Introduction with ApplicationsStatisticsISBN:9781119256830Author:Amos GilatPublisher:John Wiley & Sons Inc
 Probability and Statistics for Engineering and th...StatisticsISBN:9781305251809Author:Jay L. DevorePublisher:Cengage Learning
 Statistics for The Behavioral Sciences (MindTap C...StatisticsISBN:9781305504912Author:Frederick J Gravetter, Larry B. WallnauPublisher:Cengage Learning
  Elementary Statistics: Picturing the World (7th E...StatisticsISBN:9780134683416Author:Ron Larson, Betsy FarberPublisher:PEARSON
 The Basic Practice of StatisticsStatisticsISBN:9781319042578Author:David S. Moore, William I. Notz, Michael A. FlignerPublisher:W. H. Freeman
 Introduction to the Practice of StatisticsStatisticsISBN:9781319013387Author:David S. Moore, George P. McCabe, Bruce A. CraigPublisher:W. H. Freeman
MATLAB: An Introduction with Applications
Statistics
ISBN:9781119256830
Author:Amos Gilat
Publisher:John Wiley & Sons Inc
Probability and Statistics for Engineering and th...
Statistics
ISBN:9781305251809
Author:Jay L. Devore
Publisher:Cengage Learning
Statistics for The Behavioral Sciences (MindTap C...
Statistics
ISBN:9781305504912
Author:Frederick J Gravetter, Larry B. Wallnau
Publisher:Cengage Learning
Elementary Statistics: Picturing the World (7th E...
Statistics
ISBN:9780134683416
Author:Ron Larson, Betsy Farber
Publisher:PEARSON
The Basic Practice of Statistics
Statistics
ISBN:9781319042578
Author:David S. Moore, William I. Notz, Michael A. Fligner
Publisher:W. H. Freeman
Introduction to the Practice of Statistics
Statistics
ISBN:9781319013387
Author:David S. Moore, George P. McCabe, Bruce A. Craig
Publisher:W. H. Freeman