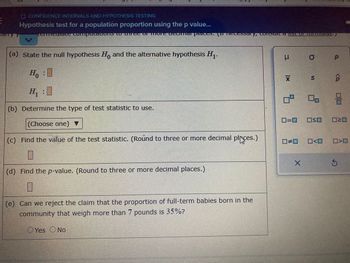
Based on their records, a hospital claims that they proportion p, of full-term babies born in the community that weight more than 7 pounds is 35%. A pediatrician who works with several hospitals in the community would like do verify the hospitals claim. I'm a random sample is 245 babies born in the community, 106 weighed over 7 pounds. Is there enough evidence to reject the hospitals claim ar 0.01 level of significance?
perform a two tailed test. Then complete the following.
carry your computations to three or more decimal places.

Step by stepSolved in 2 steps

Answers are wrong z=2.712 not 2.714 Where are the rest of the answers.. this is incomplete and wrong..
Answers are wrong z=2.712 not 2.714 Where are the rest of the answers.. this is incomplete and wrong..
- The standard IQ test has a mean of 99, and a standard deviation of 16. We want to be 90% certain that we are within 5 IQ points of the true mean. Determine the required sample size.arrow_forwardYou collect information on a random sample of women and obtain estimates on vitamin D exposure. However, the results that you find are different than those conducted at another study site. Should you be concerned? Explain your answer using the concept of sampling variabilityarrow_forwardA survey found that women's heights are normally distributed with mean 63.6in and standard deviation 2.2 in. A branch of the military requires women's heights to be between 58 in and 80 in. a. Find the percentage of women meeting the height requirement. Are many women being denied the opportunity to join this branch of the military because they are too short or too tall? b. If this branch of the military changes the height requirements so that all women are eligible except the shortest 1% and the tallest 2%, what are the new height requirements? a. The percentage of women who meet the height requirement is nothing%. (Round to two decimal places as needed.)arrow_forward
- A dietitian wishes to see if a person's cholesterol level will change if the diet is supplemented by a certain mineral. Seven subjects were pretested and then took the mineral supplement for a six-week period. The results are shown below in the table. Use a paired samples t-chart at a = 0.01 significance level to see difference (Before - After) between the cholesterol levels. State the hypotheses and conclusion. Also, conduct a 99% confidence interval. Subject 1 Before 210 After 190 2 205 170 3 208 210 4 192 188 5 178 173 6 244 228 7 211 198arrow_forwardThe US Department of Energy reported that 45% of homes were heated by natural gas. A random sample of 348 homes in Oregon found that 156 were heated by natural gas. Test the claim that proportion of homes in Oregon that were heated by natural gas is different than what was reported. Use a 1% significance level. Give answer to at least 4 decimal places. What are the correct hypotheses? (Select the correct symbols and use decimal values not percentages.) Ho: P Test Statistic = =✓ ✓ OF H₁: P Based on the hypotheses, compute the following: p-value = 45 0° 45 OB voarrow_forwardThe Chancellor wants you to calculate the sample size needed with a margin of error of 15, 99% confidence, and a population standard deviation of 22.arrow_forward
- A survey found that women's heights are normally distributed with mean 63.4 in and standard deviation 2.5 in. A branch of the military requires women's heights to be between 58 in and 80 in. a. Find the percentage of women meeting the height requirement. Are many women being denied the opportunity to join this branch of the military because they are too short or too tall? b. If this branch of the military changes the height requirements so that all women are eligible except the shortest 1% and the tallest 2%, what are the new height requirements?arrow_forwardA publisher reports that 69 % of their readers own a particular make of car. A marketing executive wants to test the claim that the percentage is actually under the reported percentage. A random sample of 200 found that 60% of the readers owned a particular make of car. Is there sufficient evidence at the 0.10 level to support the executive's claim? Step 5 of 7: Identify the value of the level of significance.arrow_forward
 MATLAB: An Introduction with ApplicationsStatisticsISBN:9781119256830Author:Amos GilatPublisher:John Wiley & Sons Inc
 Probability and Statistics for Engineering and th...StatisticsISBN:9781305251809Author:Jay L. DevorePublisher:Cengage Learning
 Statistics for The Behavioral Sciences (MindTap C...StatisticsISBN:9781305504912Author:Frederick J Gravetter, Larry B. WallnauPublisher:Cengage Learning
 Elementary Statistics: Picturing the World (7th E...StatisticsISBN:9780134683416Author:Ron Larson, Betsy FarberPublisher:PEARSON
 The Basic Practice of StatisticsStatisticsISBN:9781319042578Author:David S. Moore, William I. Notz, Michael A. FlignerPublisher:W. H. Freeman
 Introduction to the Practice of StatisticsStatisticsISBN:9781319013387Author:David S. Moore, George P. McCabe, Bruce A. CraigPublisher:W. H. Freeman


